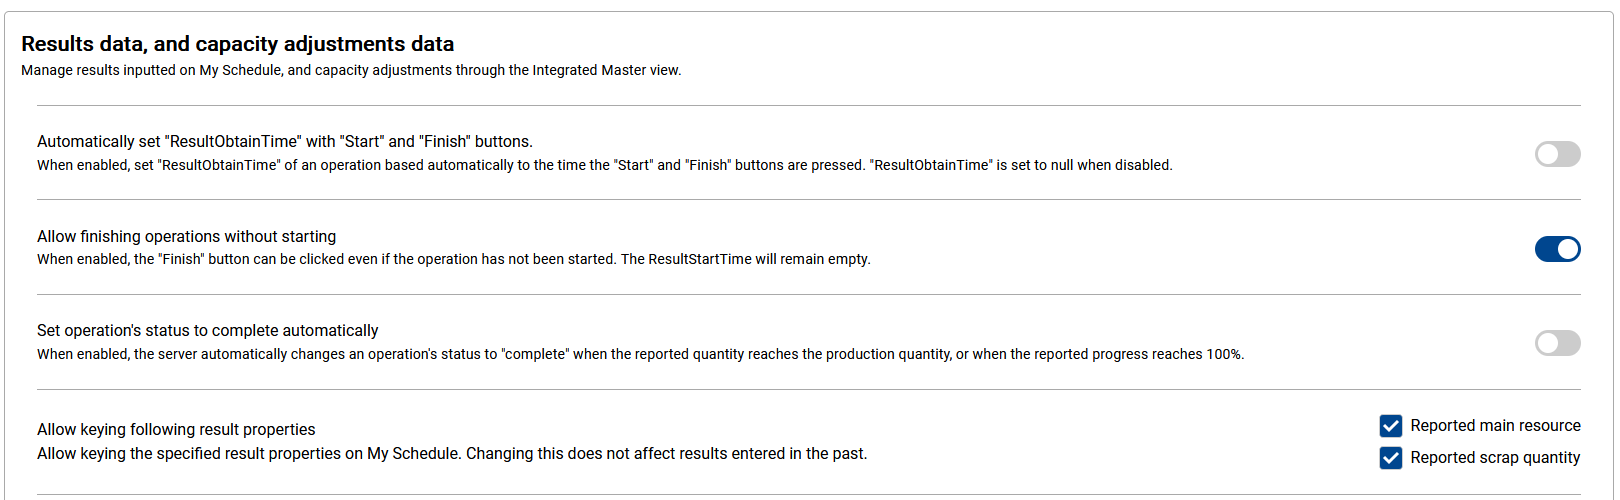
Asprova My Schedule prior to ver. 1.5 does not support English as a display language.
Asprova My Schedule is a product that enables viewing production schedules scheduled by Asprova and entering actual performance data related to the schedule via a web browser.
Components of My Schedule
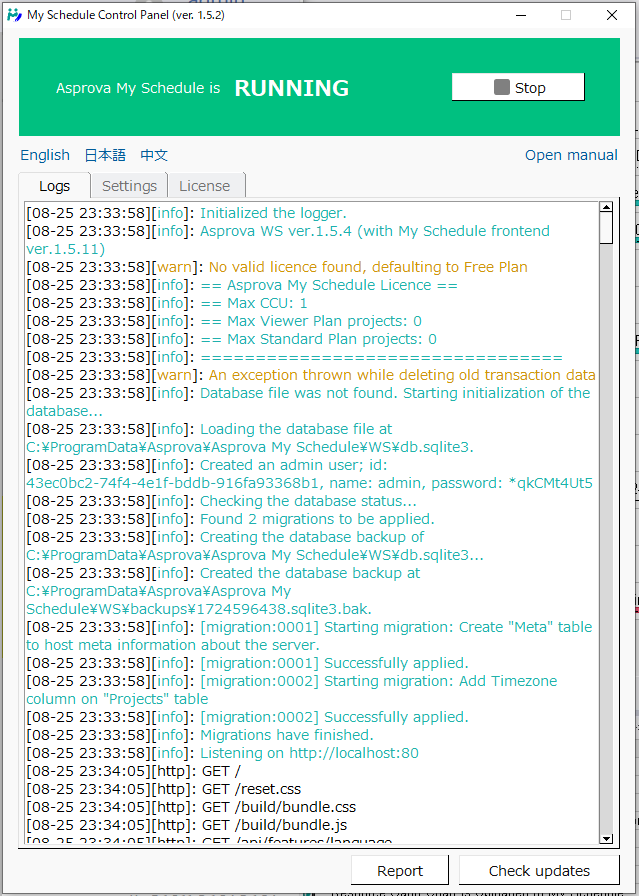
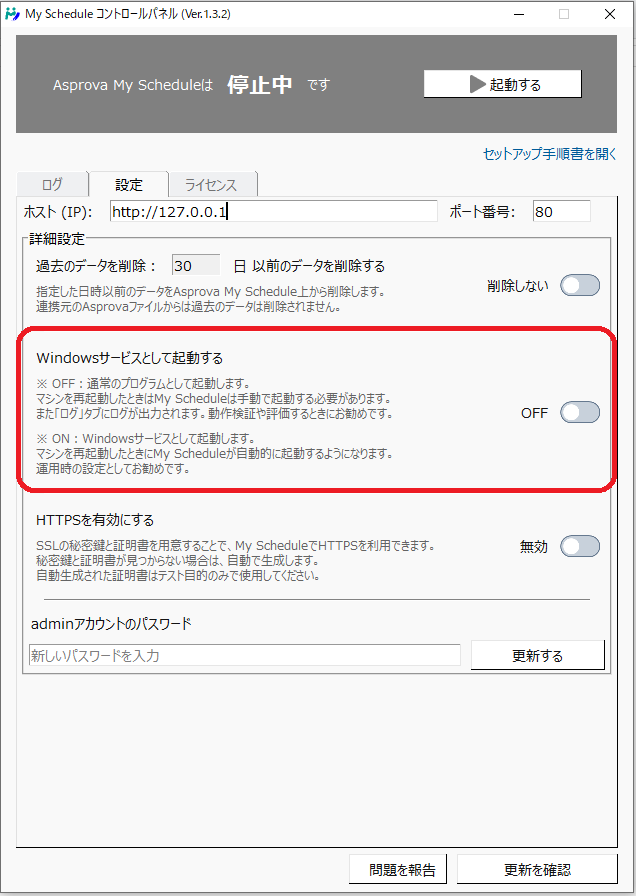
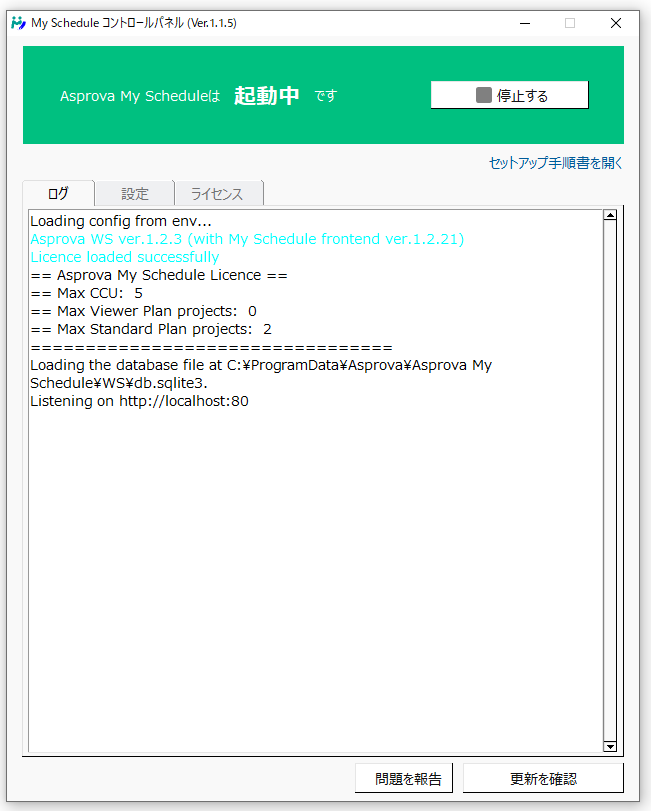
My Schedule consists of a plugin that uploads data from Asprova, a server (Asprova WS) that stores the data, a control panel to manage the server, and the My Schedule front-end displayed in a browser. For more details, please refer to the manual download page.
Free Plan / Standard Plan
My Schedule offers two plans: a Free Plan, which is available for use at no cost, and a Standard Plan. In the Standard Plan projects, in addition to all the features available in the Free Plan, it is possible to enter actual performance data on My Schedule and import this data into Asprova.
The following additional features are available in Standard Plan projects:
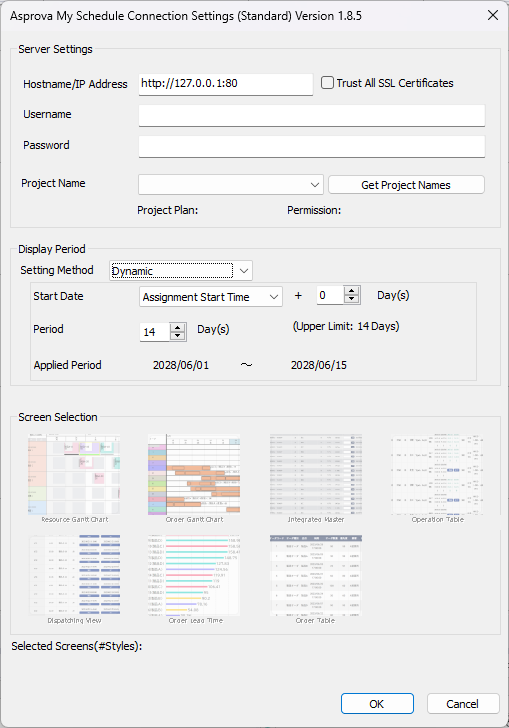
- The period for uploading data from Asprova becomes unlimited (in the Free Plan, it is limited to two weeks).
- Actual performance data can be entered on My Schedule and imported into Asprova.
- The number of simultaneous connections, which is fixed at 1 in the Free Plan, increases to 5. Additional simultaneous connections can also be purchased (for a fee).
- The Manufacturing BOM Table can be utilized.
Available UIs
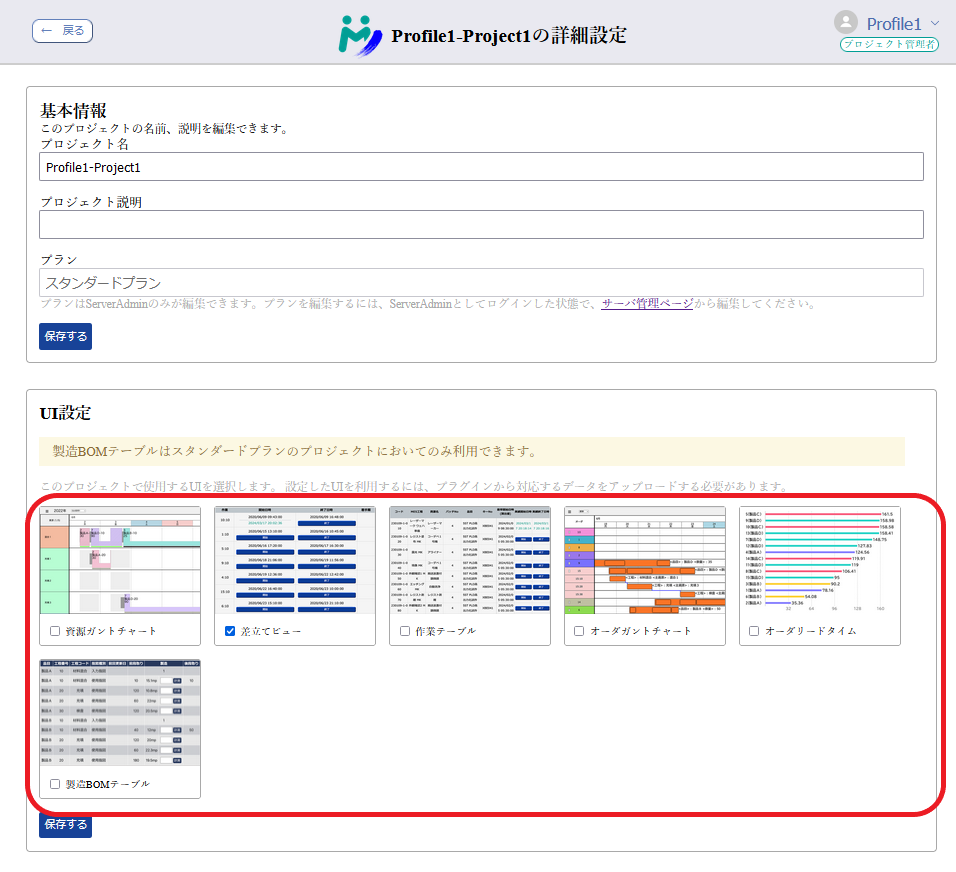
Six UIs are available: Resource Gantt Chart, Dispatching View, Operation Table, Order Gantt Chart, Order Lead Time, and Manufacturing BOM Table. The Manufacturing BOM Table is available only in Standard Plan projects.
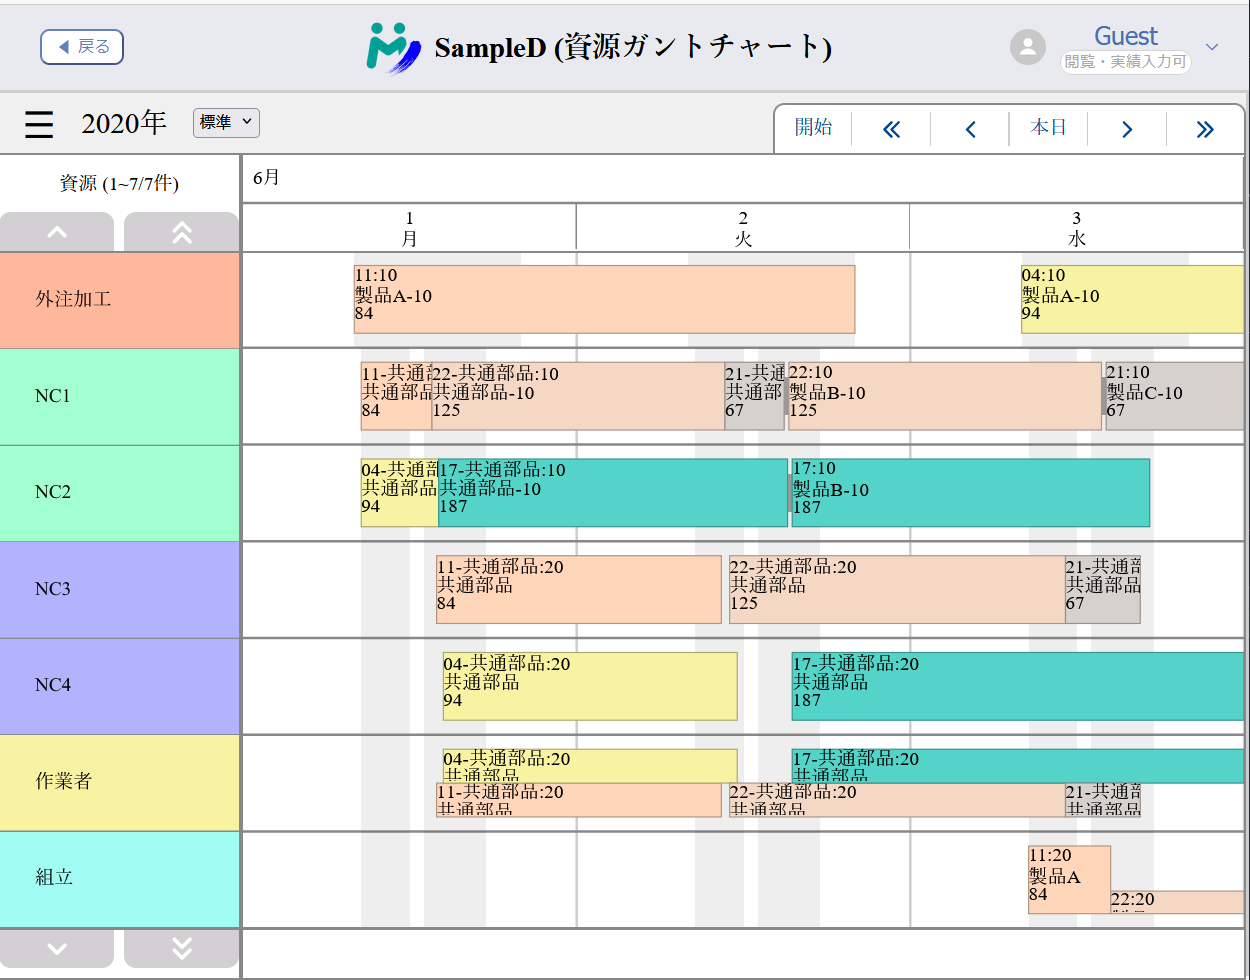
Resource Gantt Chart
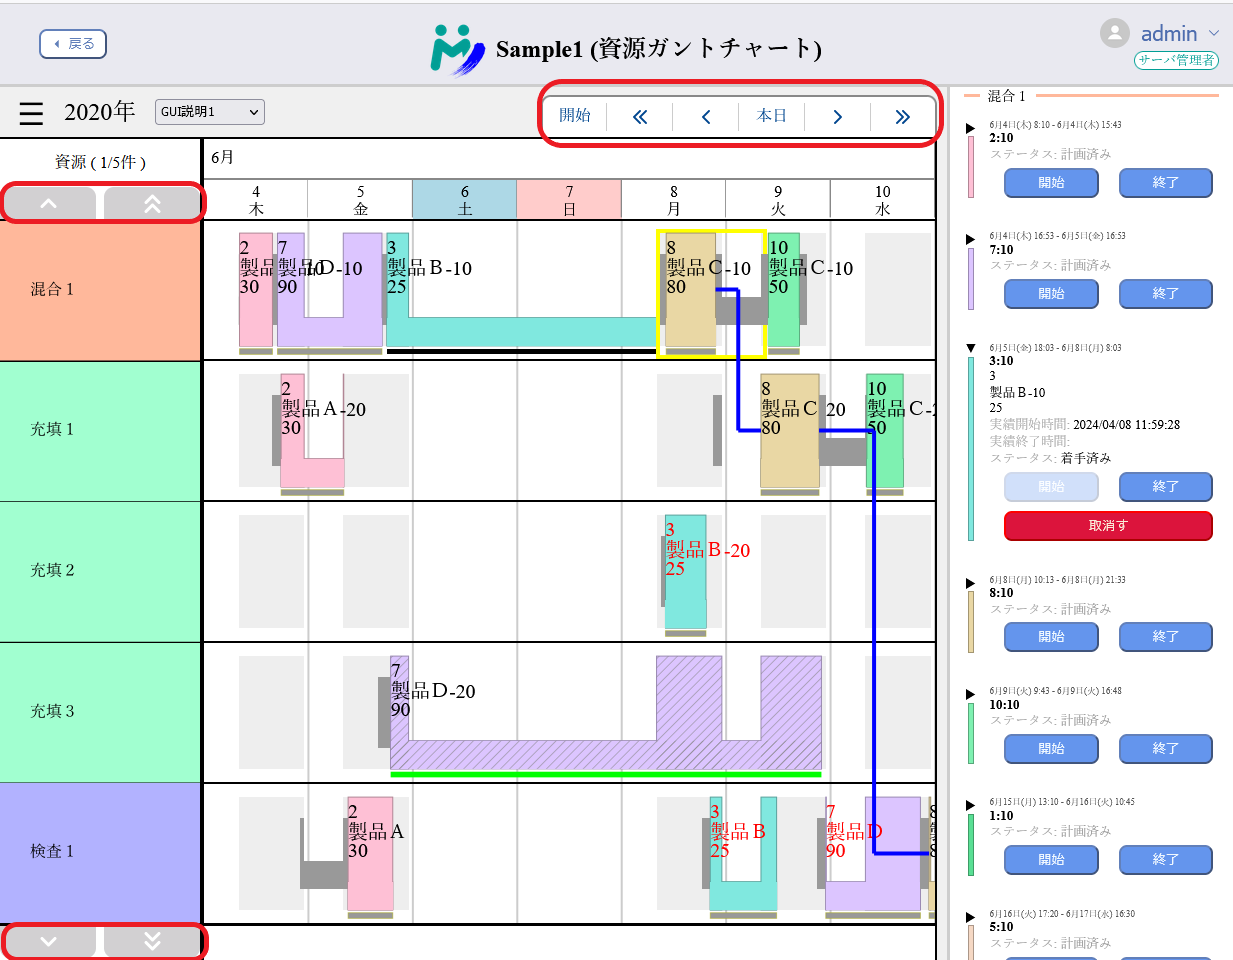
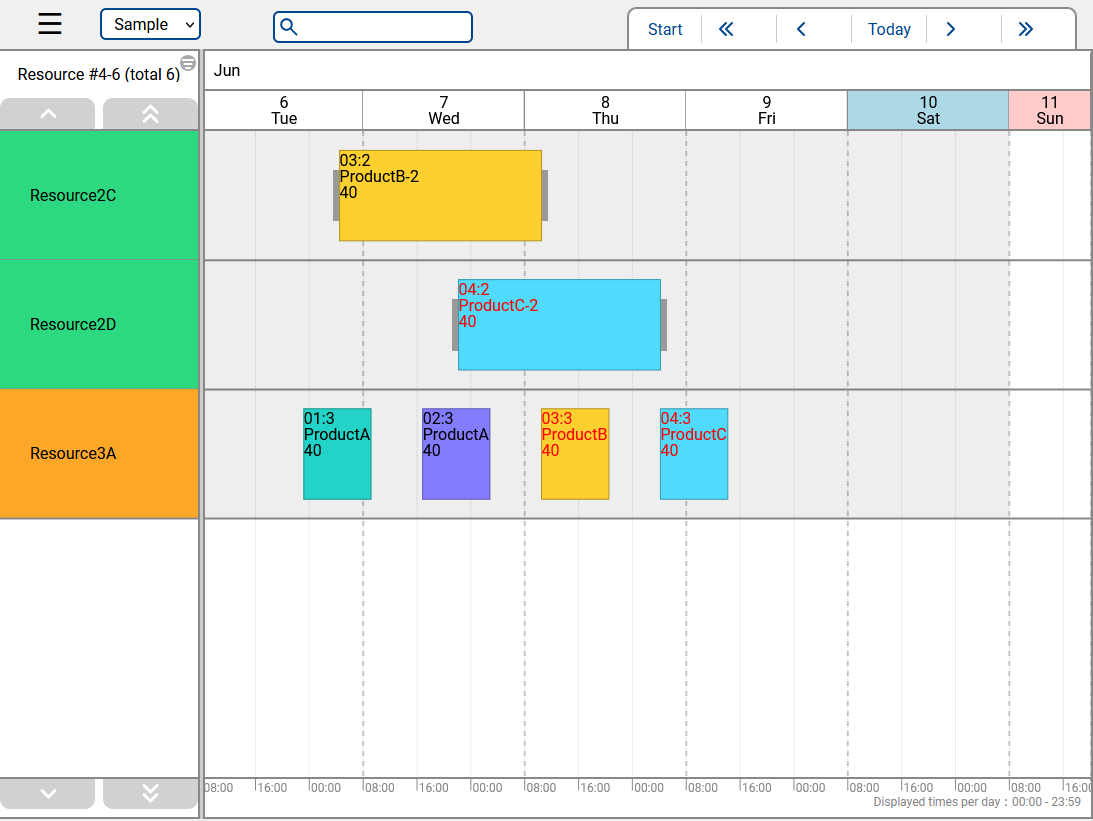
In the Resource Gantt Chart, you can view the scheduled tasks for each resource. Similar to Asprova's Resource Gantt Chart, it displays connection lines between tasks in sequential processes and setup times. Based on user feedback regarding the overlapping text in Asprova's instruction bars making it difficult to read, we have added a panel on the right to display the currently selected tasks vertically.
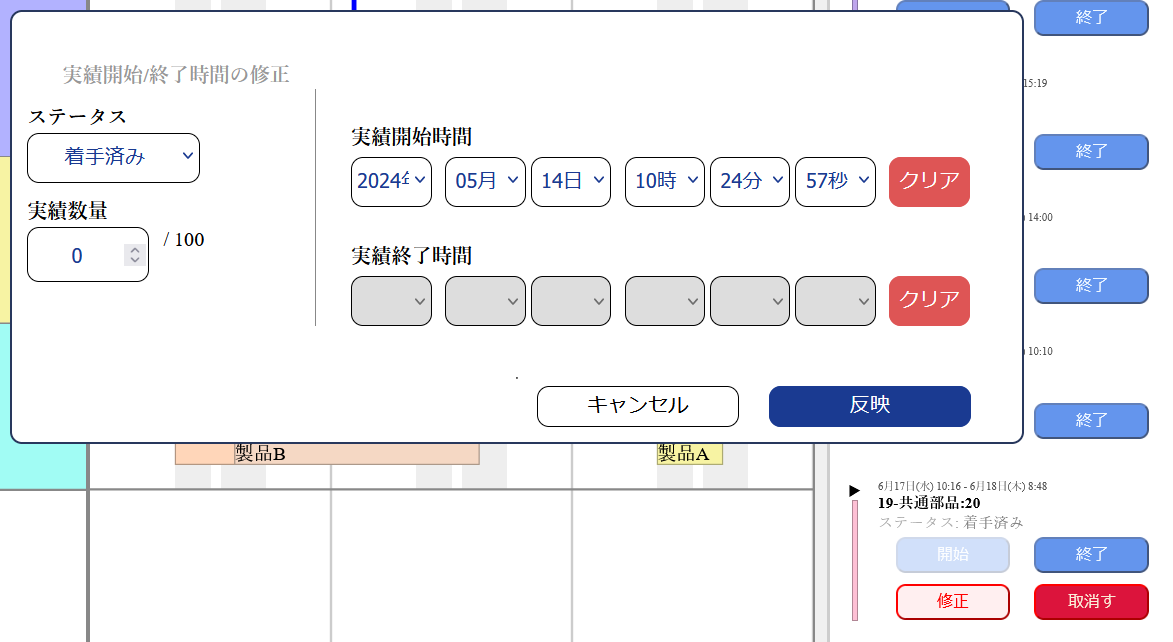
You can enter the actual start and end times of tasks in the right panel. The entered data will be reflected in other UIs such as the Assignment View.
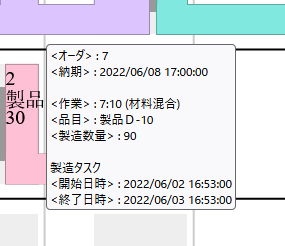
Similar to Asprova, tooltips can be displayed when hovering the mouse over an item.
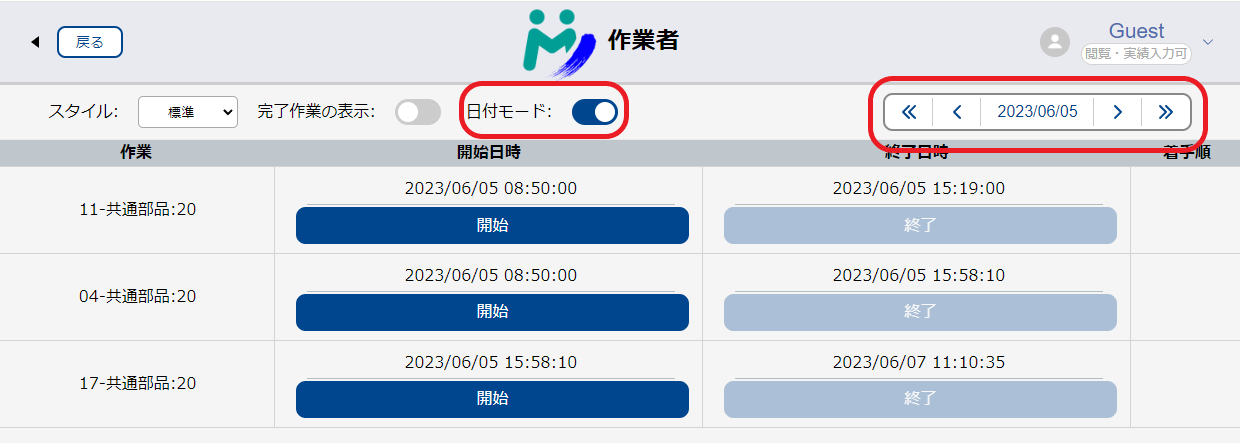
Dispatching View
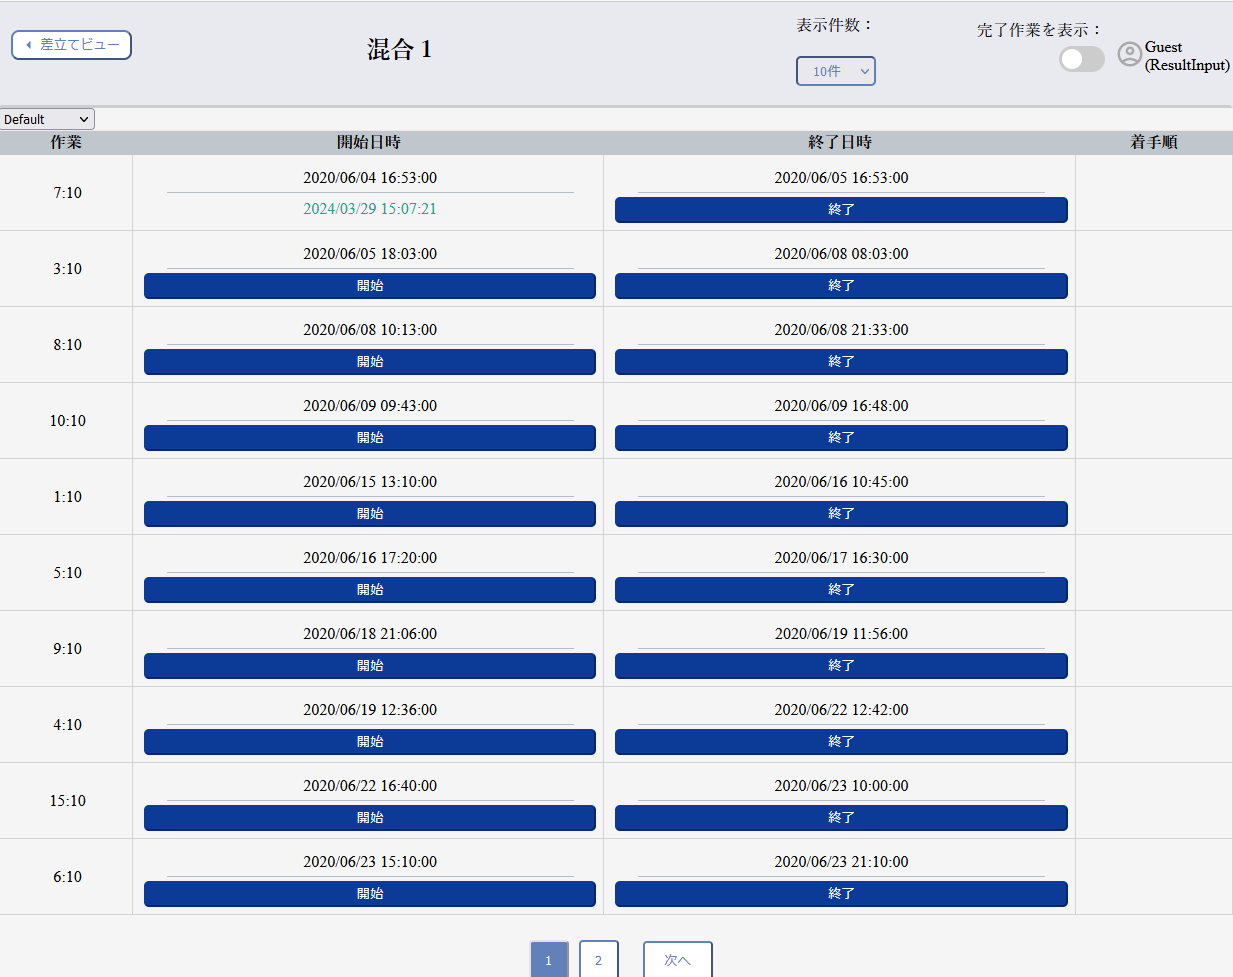
In the Dispatching View, you can view the assignments for each resource. By uploading data via the plugin, the styles from Asprova can be applied.
You can enter the actual start and end times of tasks. The entered data will be reflected in other UIs such as the Resource Gantt Chart.
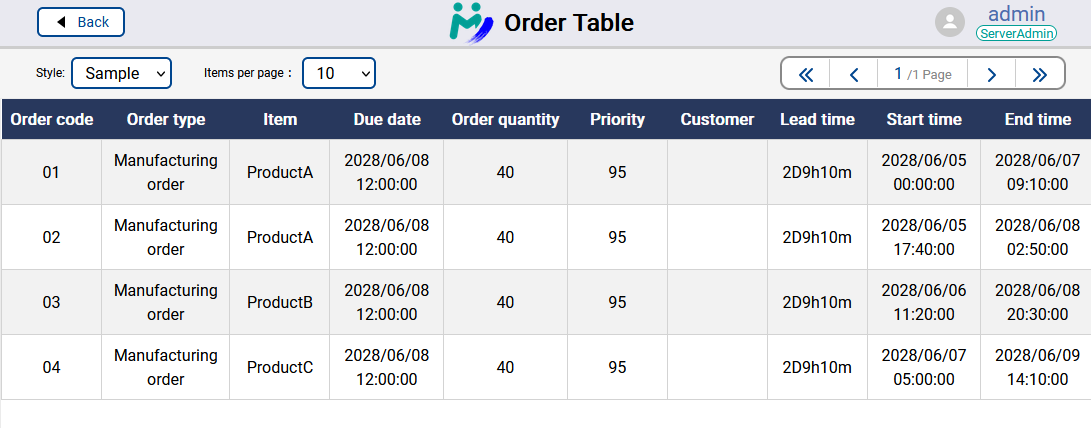
Operation Table
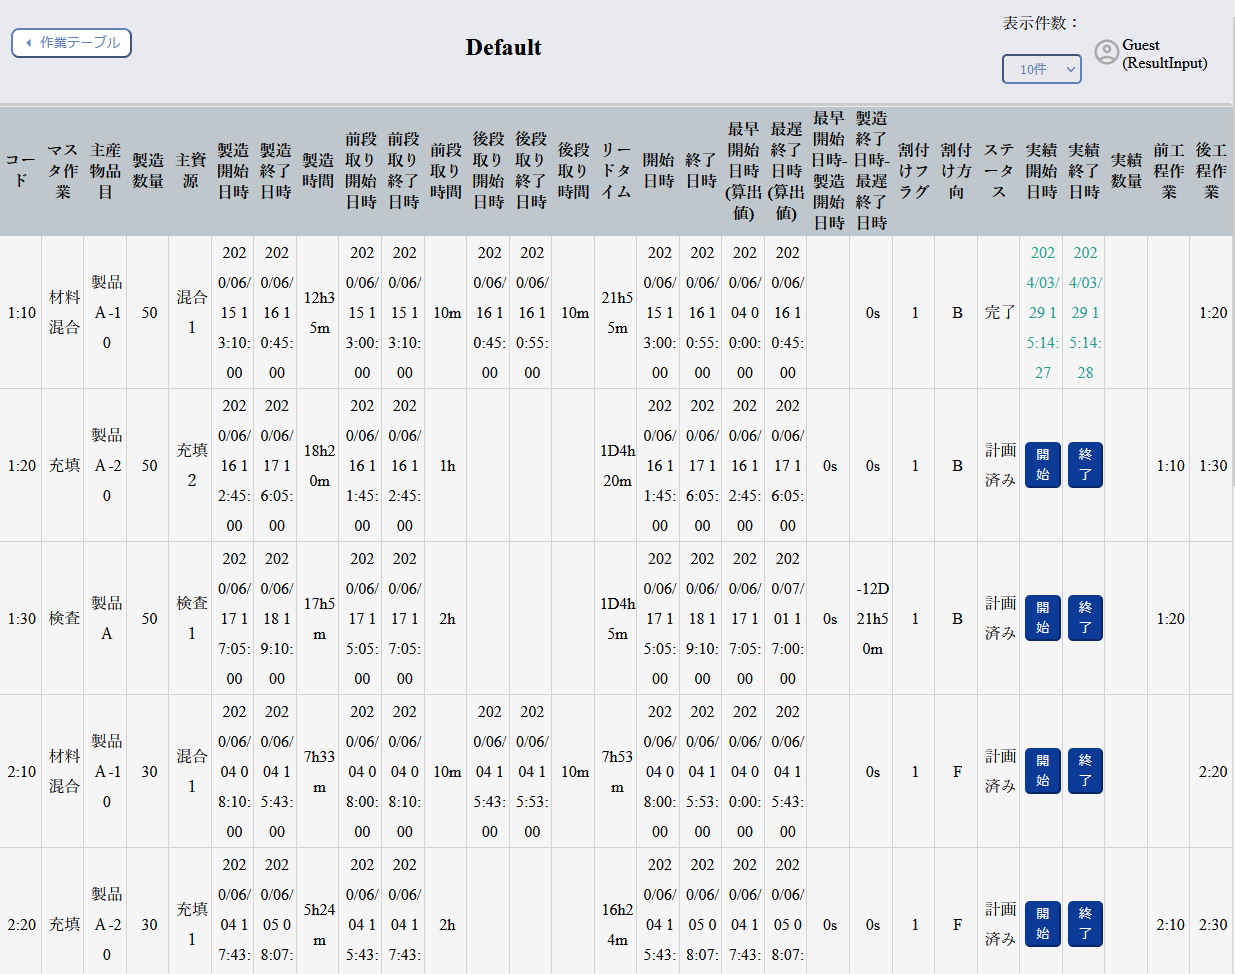
In the Operation Table, you can view a list of tasks.
You can enter the actual start and end times of tasks. The entered data will be reflected in other UIs such as the Resource Gantt Chart.
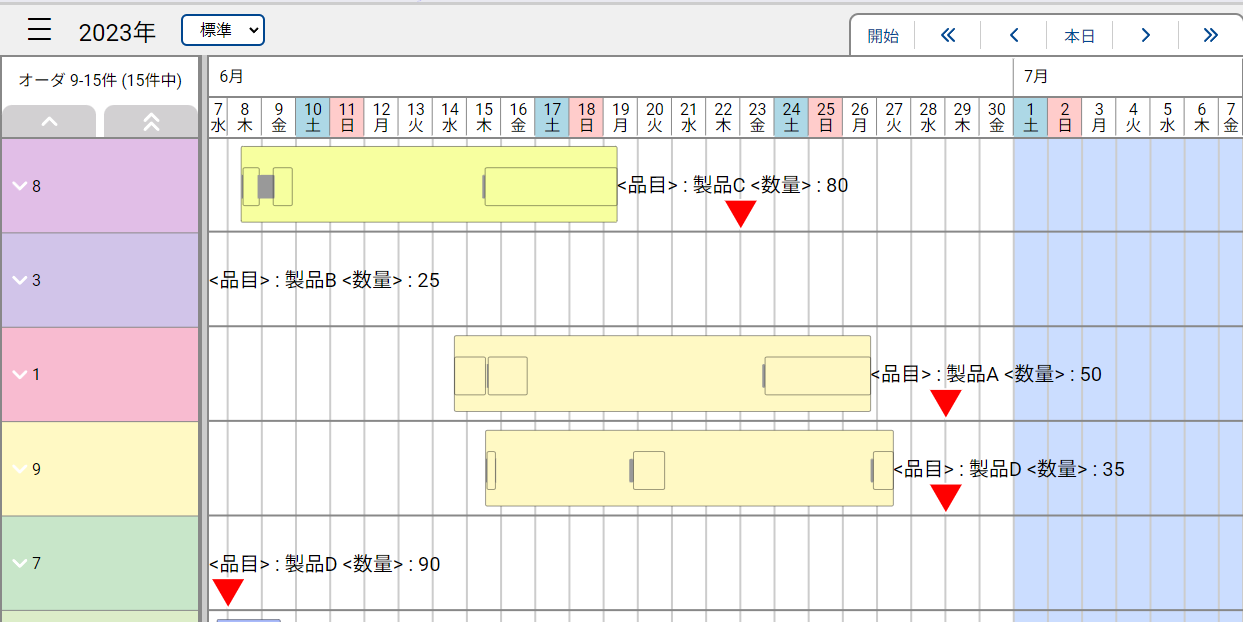
Order Gantt Chart
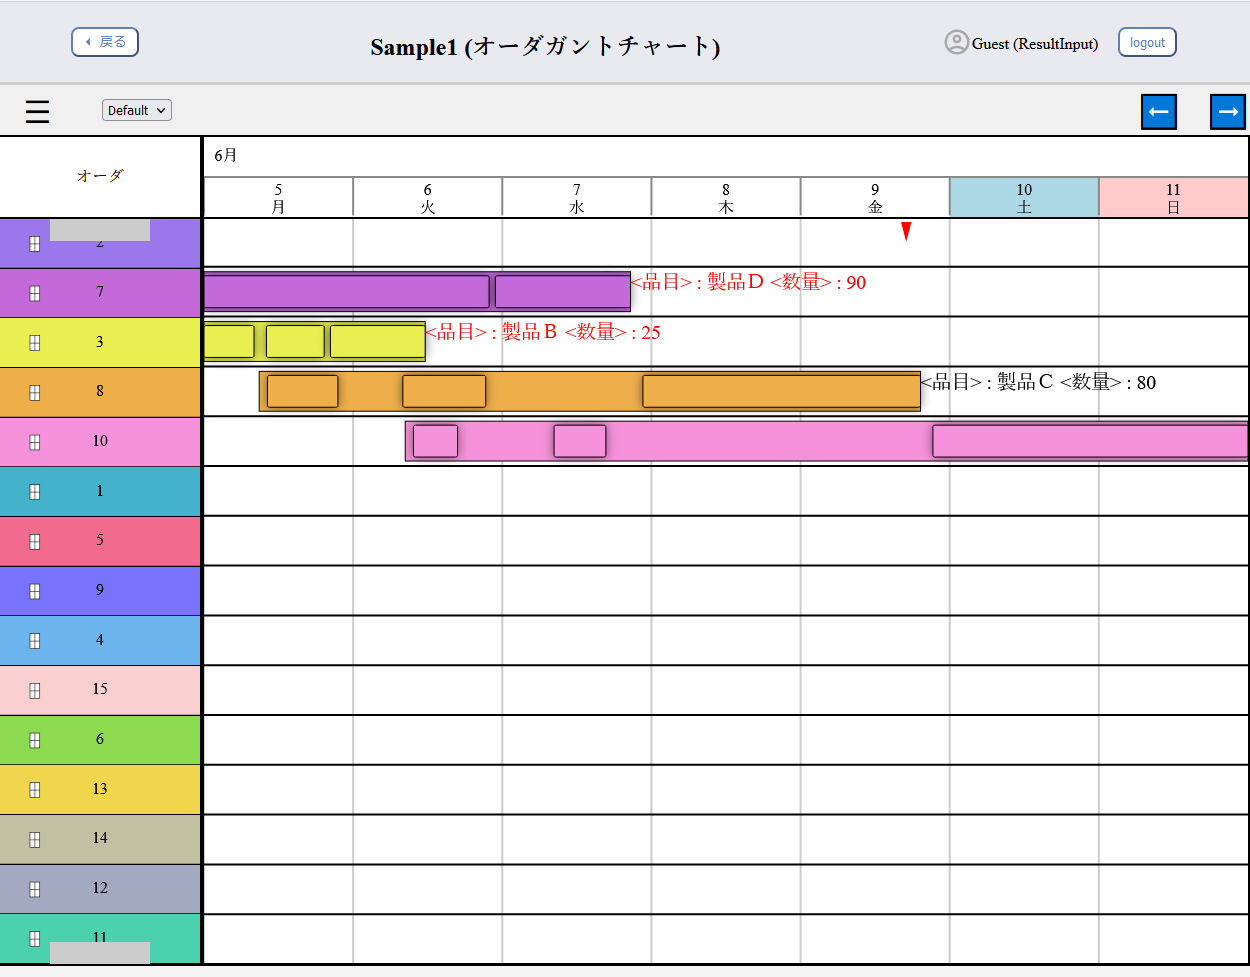
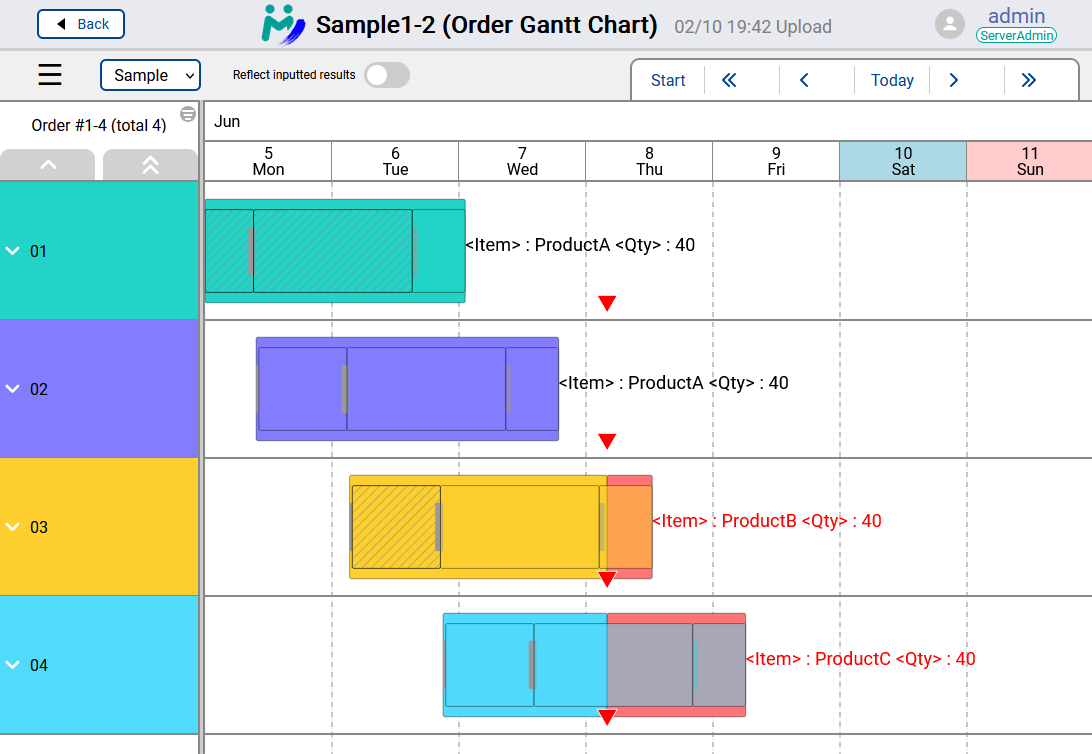
You can view the Order Gantt Chart. The style of Asprova's Order Gantt Chart can be applied.
Similar to Asprova, orders that are delayed can be displayed in red.
Manufacturing BOM Table
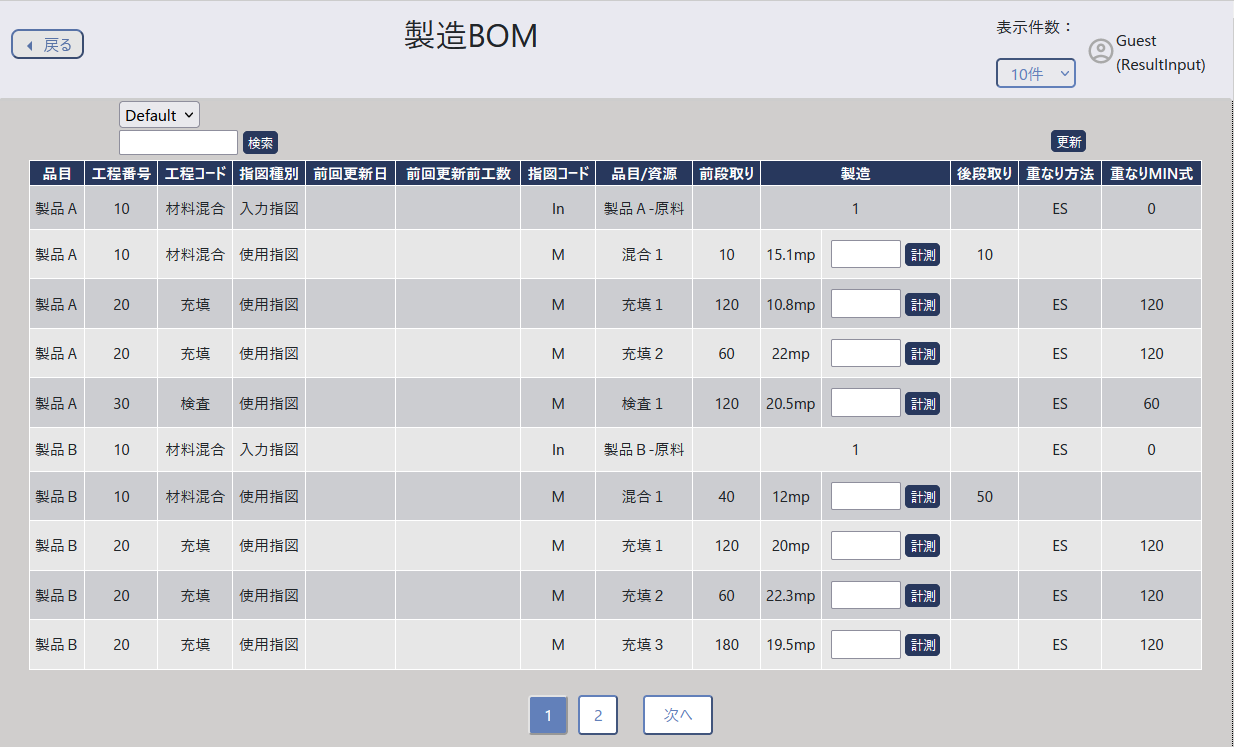
In the Manufacturing BOM Table, you can view the Manufacturing BOM.
A Standard Plan is required to use the Manufacturing BOM Table.
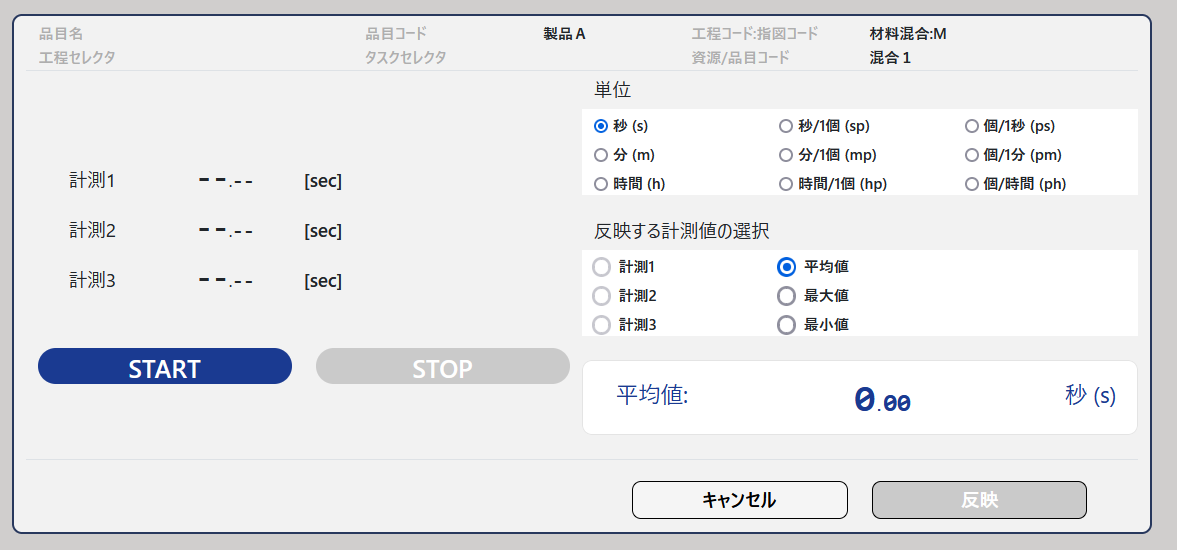
For the Manufacturing BOM instructions, you can measure and update the manufacturing time.
Order Lead Time
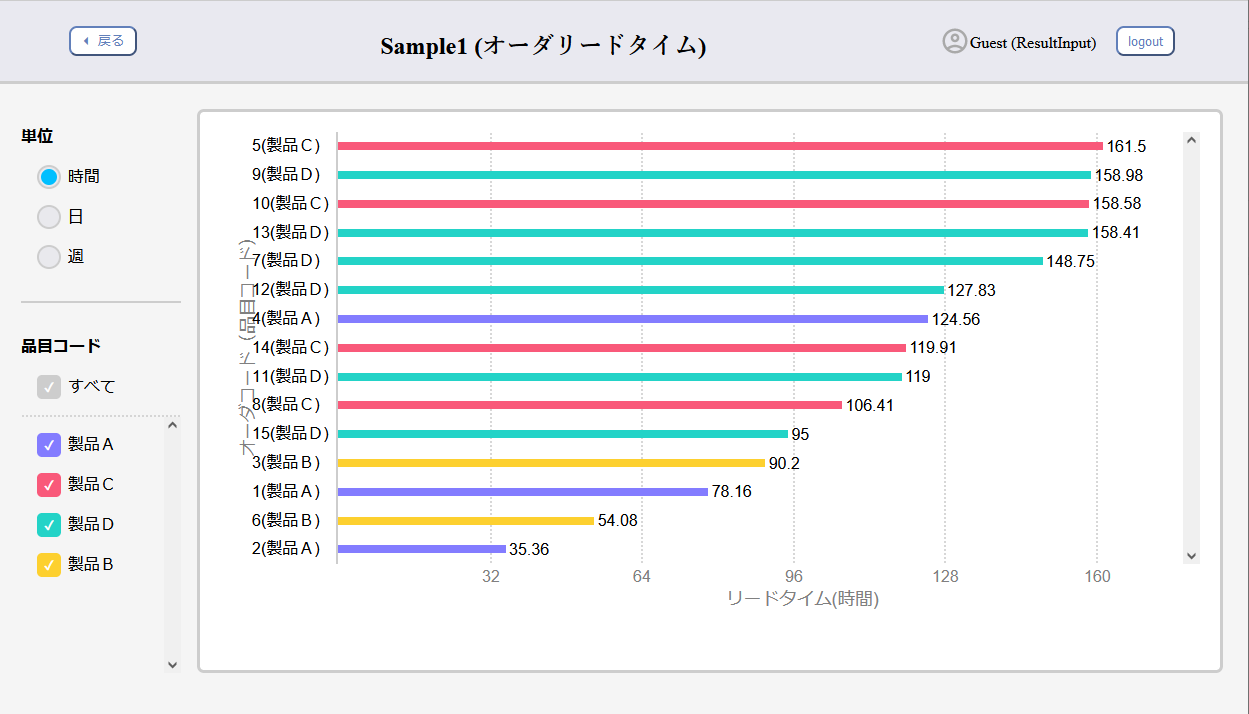
In the Order Lead Time UI, the lead time for each order can be displayed in an easy-to-read graphical format.
Project Management
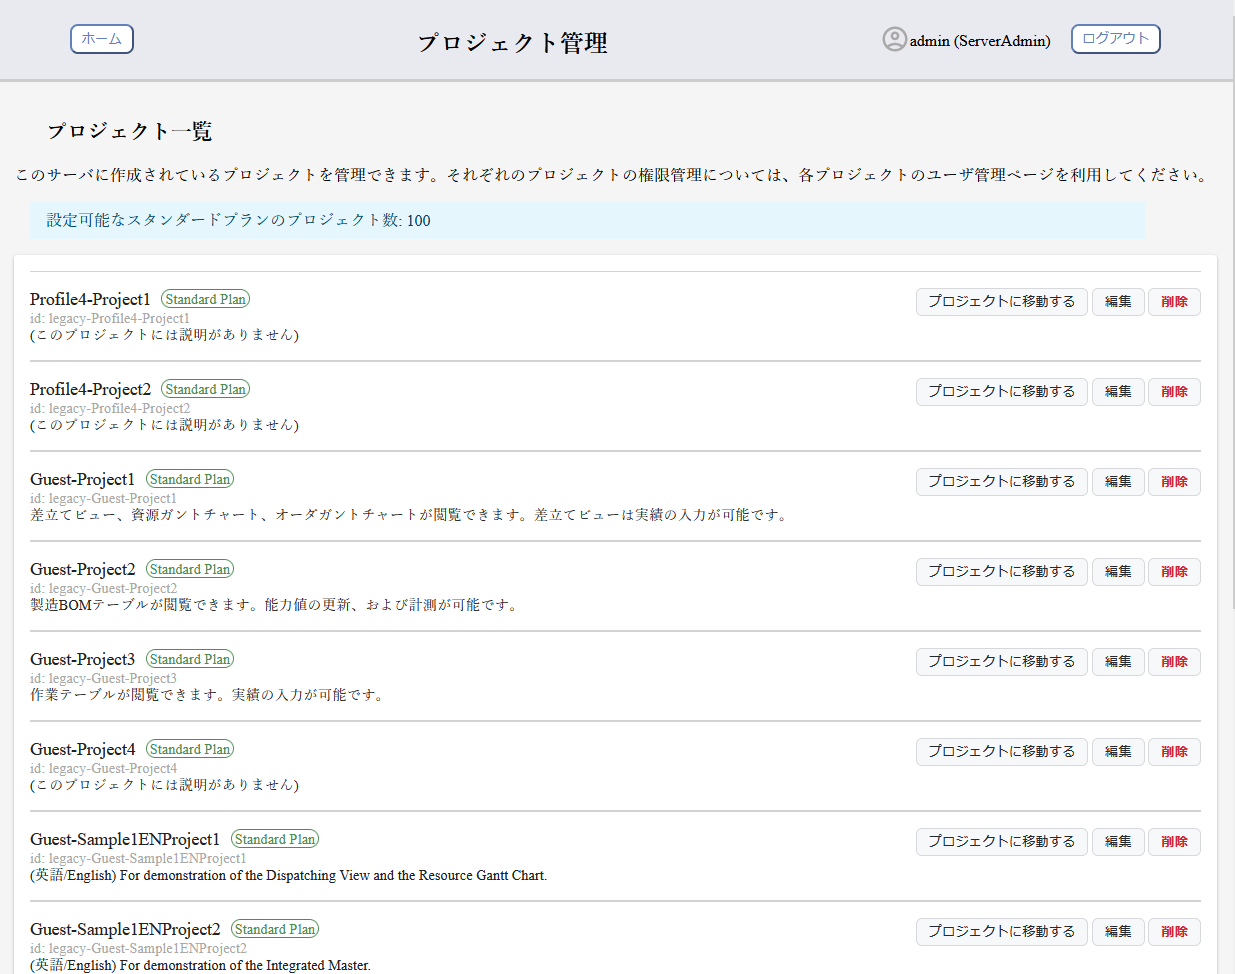
On the Asprova WS server, Free Plan projects can be created without any limit on the number of projects. The number of Standard Plan projects that can be created is determined by the license.
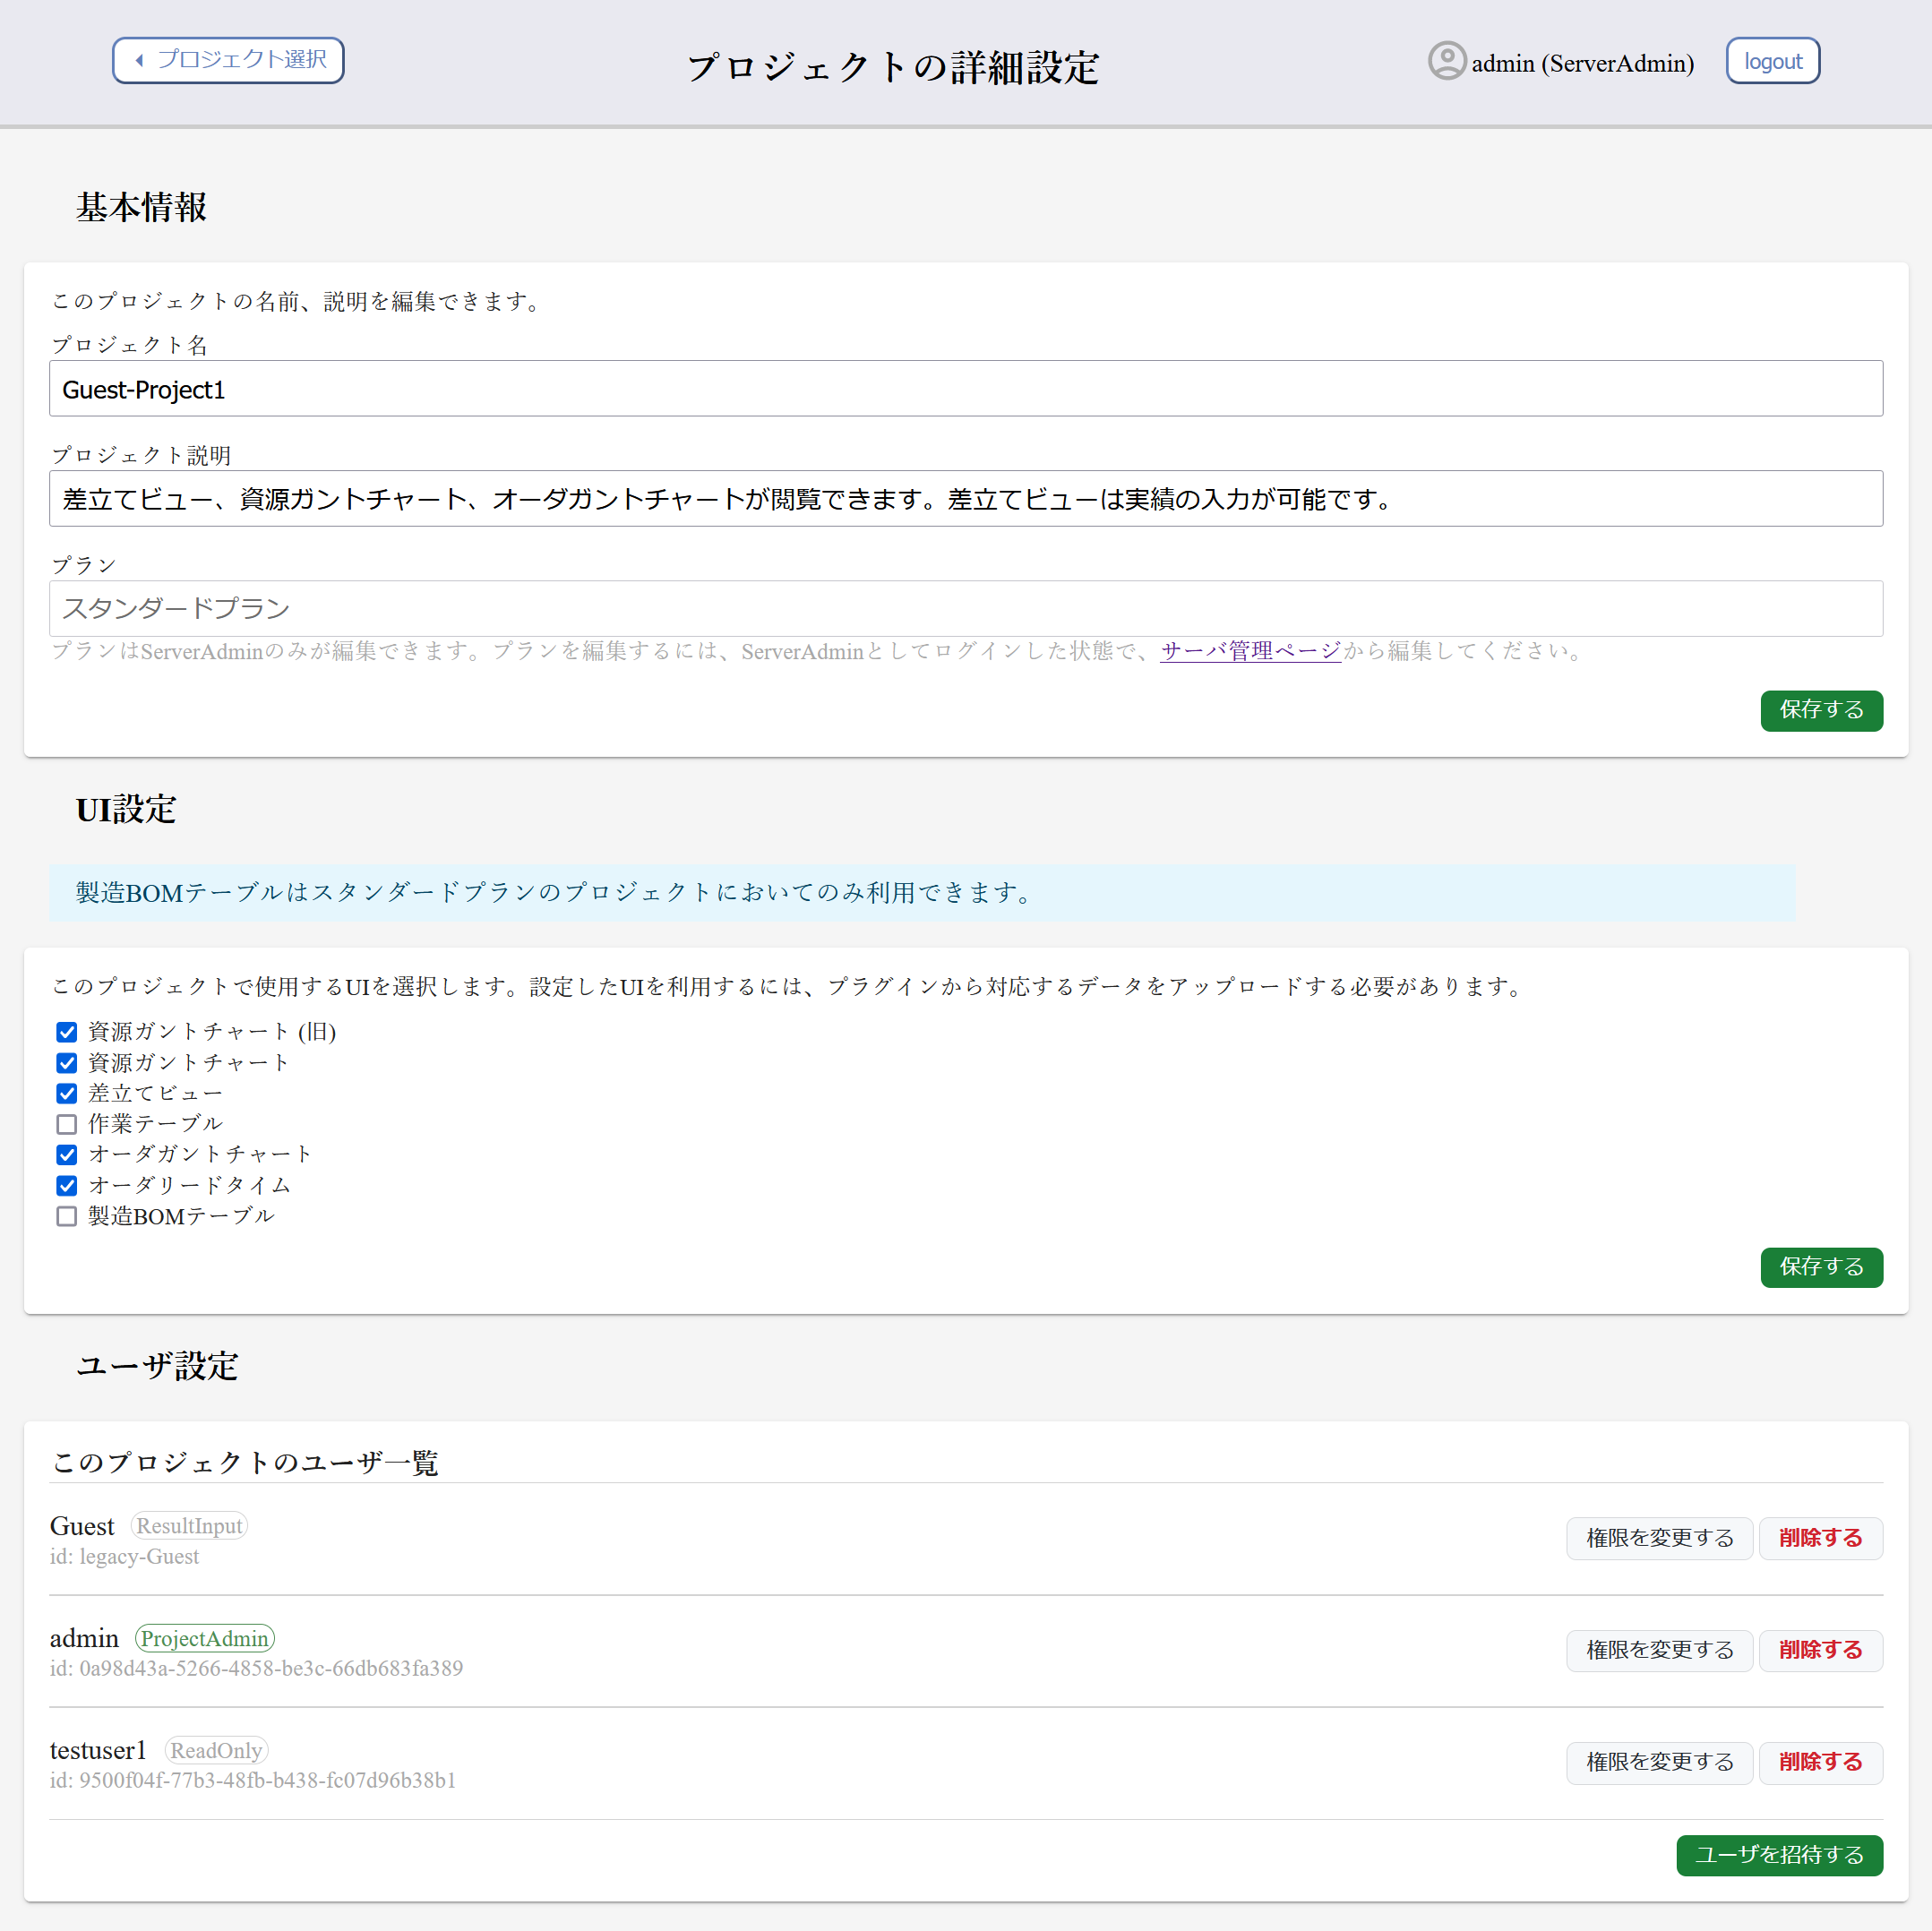
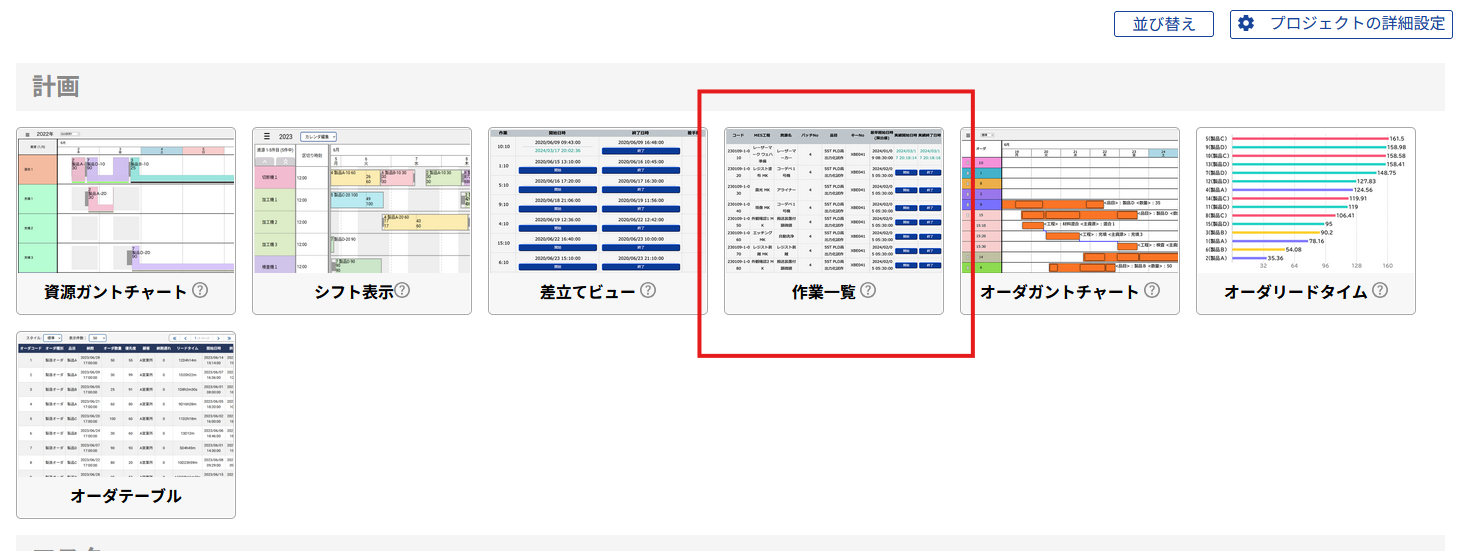
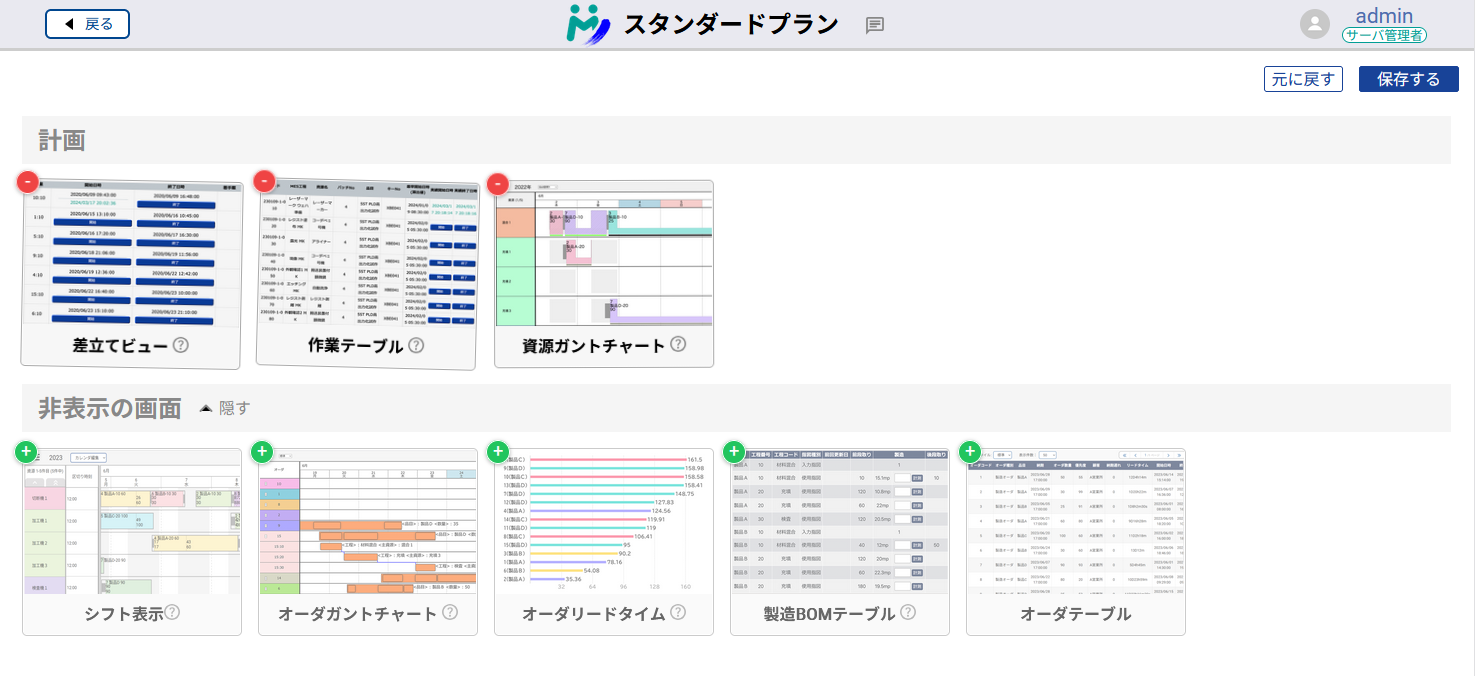
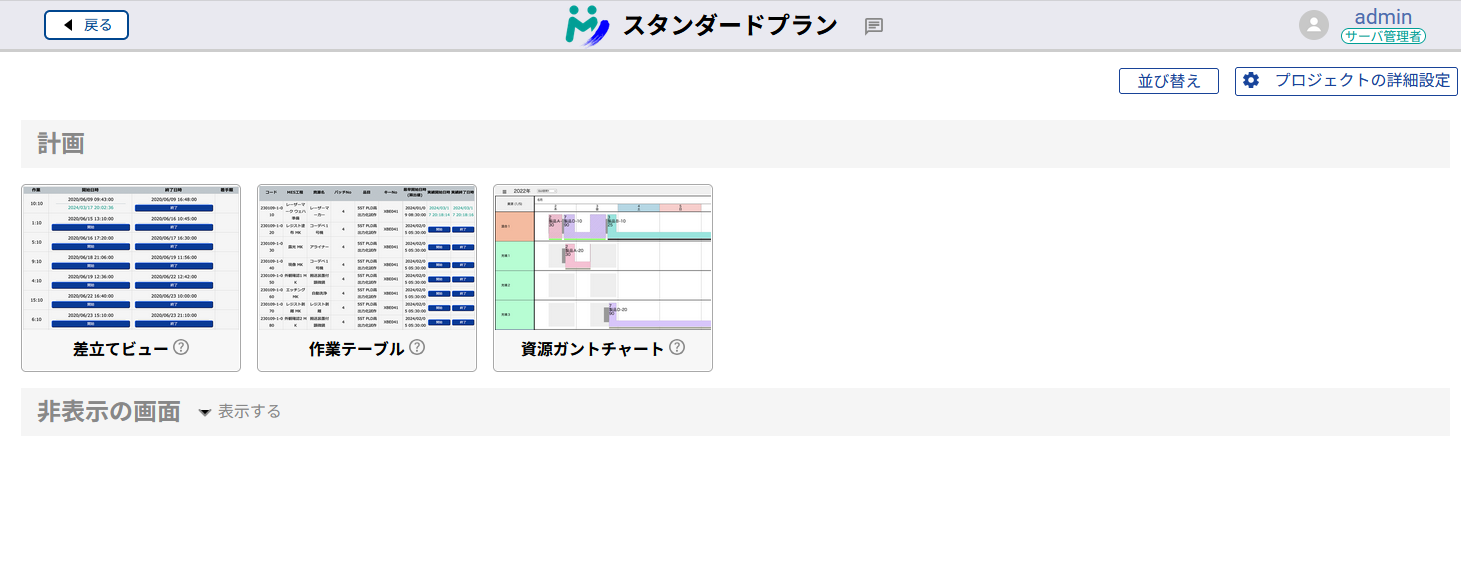
For each project that is created, you can finely configure which UIs to use and which users are able to view the project or input actual result data.
 The current time is displayed on Gantt Charts with an orange line.
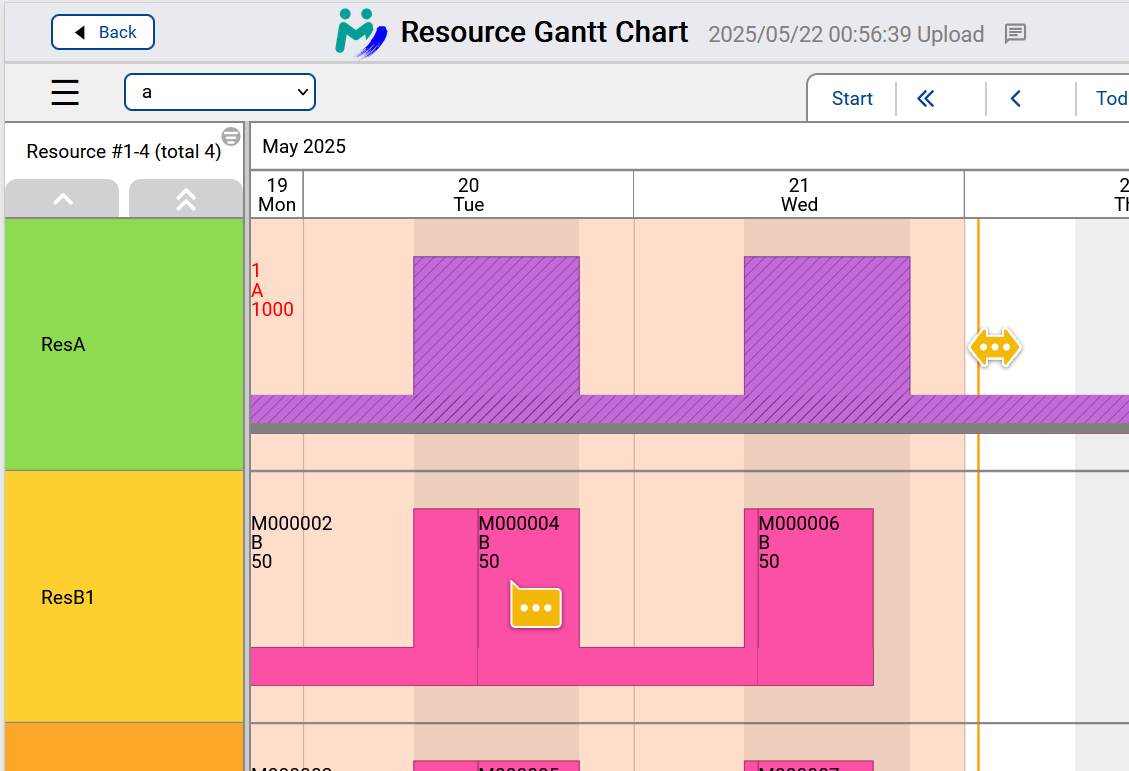
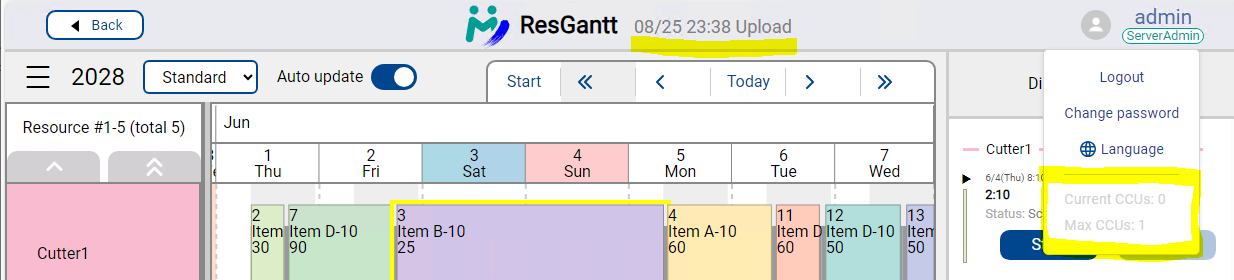
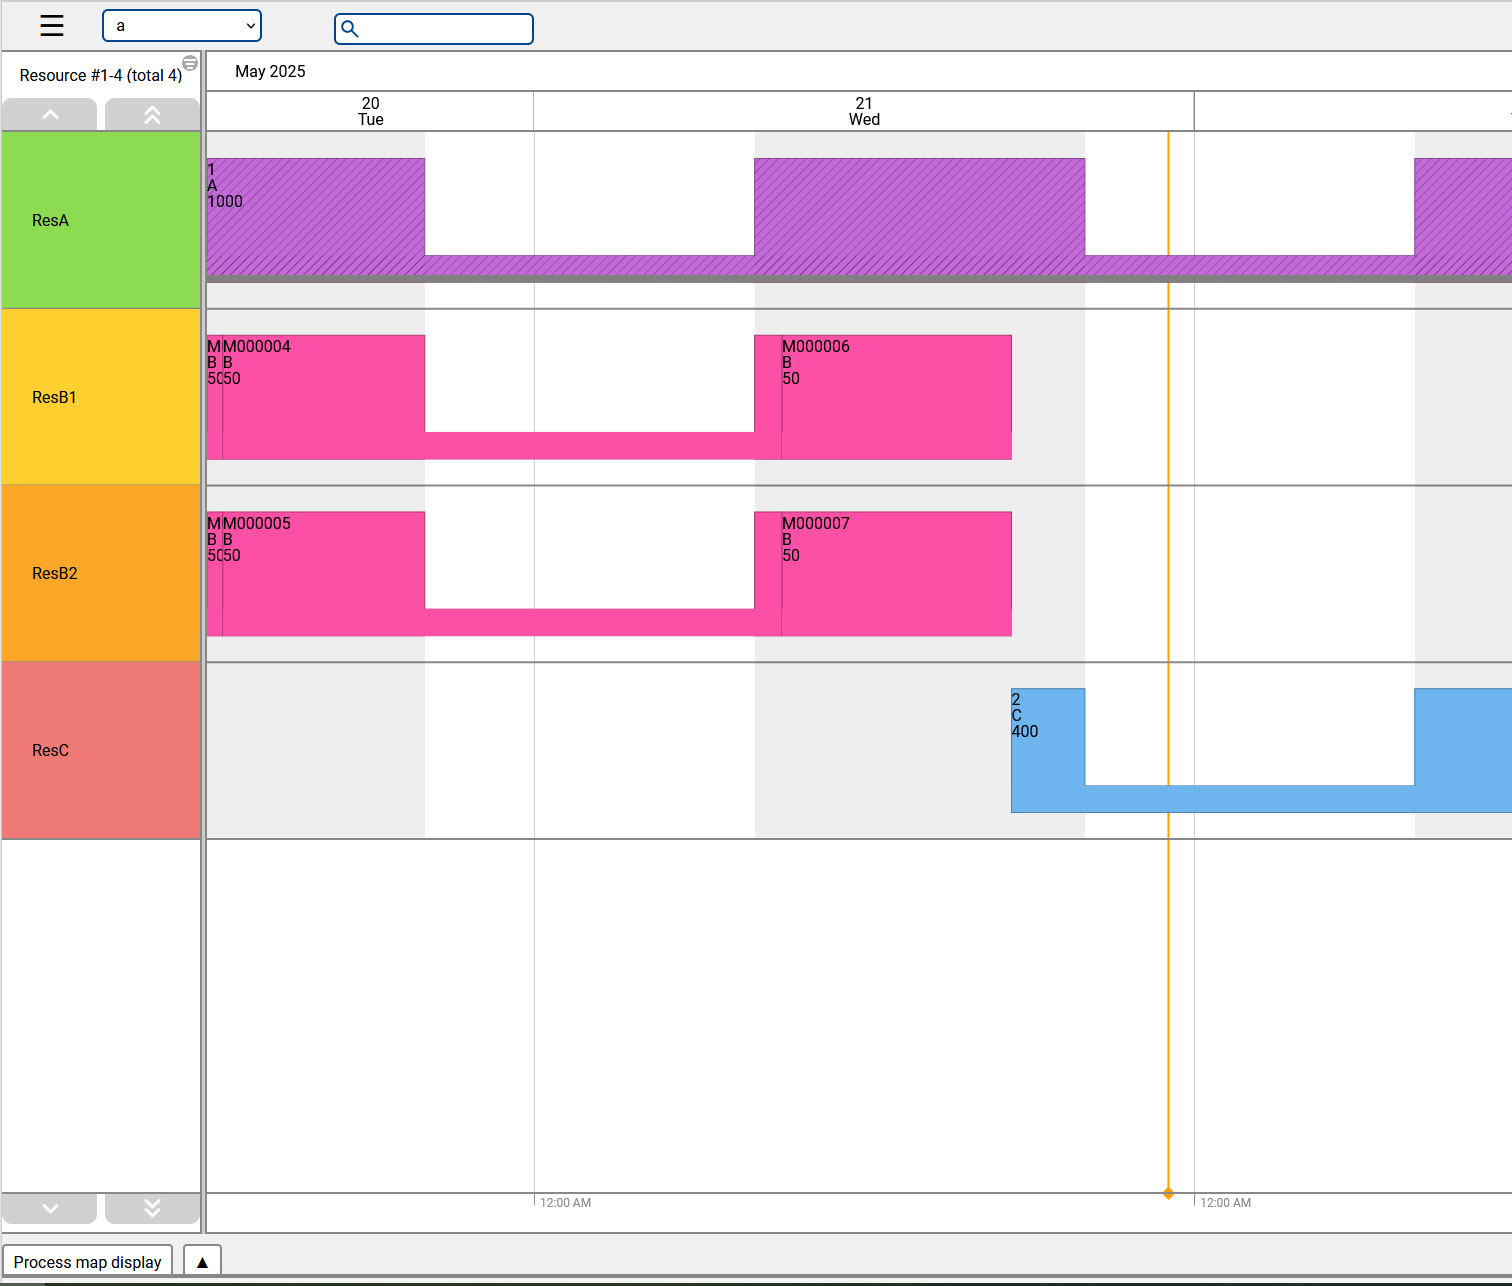
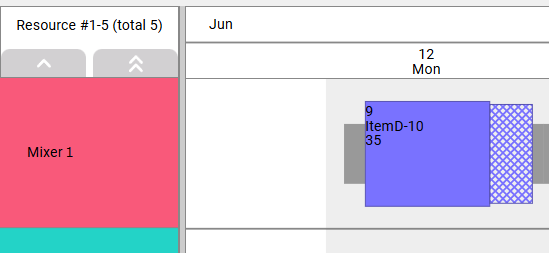
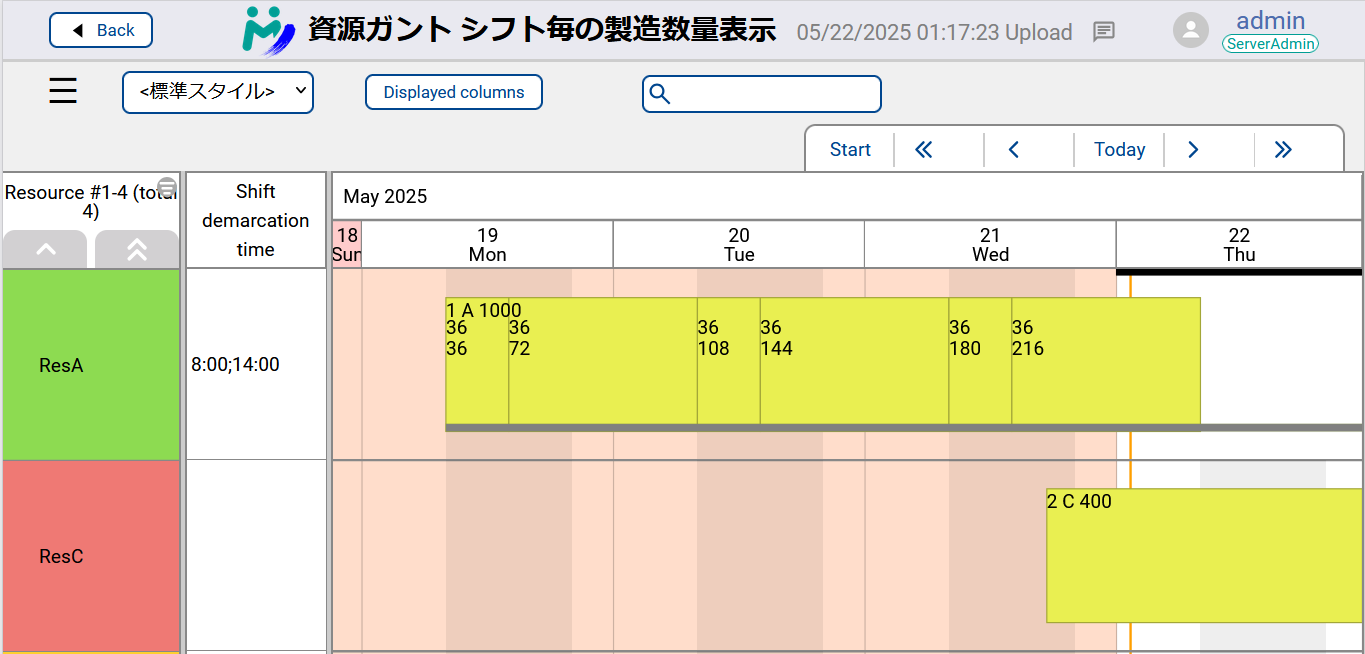 A new variant of Resource Gantt Chart is added where operation bars are split by shifts configured in the Aru file.
Each shift block has two numbers: production quantity in the shift, and cumulative production quantity to the shift.
See
A new variant of Resource Gantt Chart is added where operation bars are split by shifts configured in the Aru file.
Each shift block has two numbers: production quantity in the shift, and cumulative production quantity to the shift.
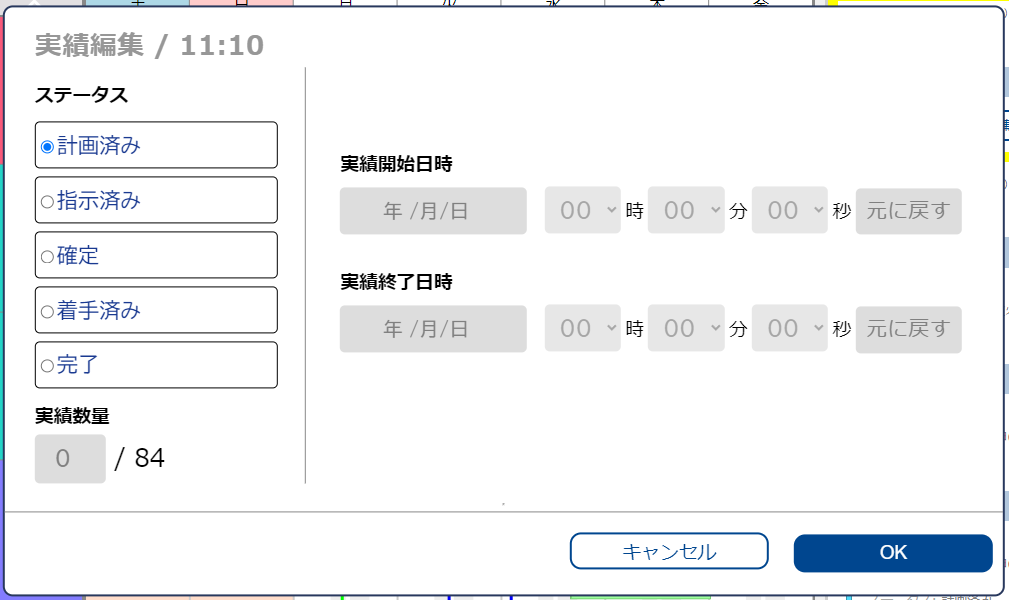
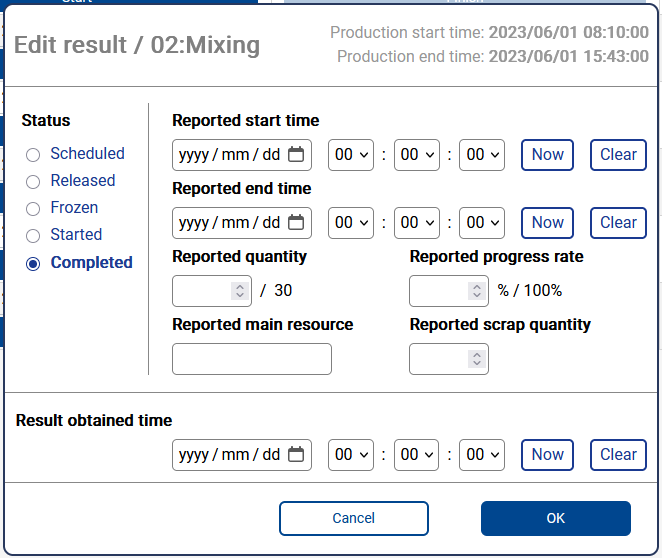
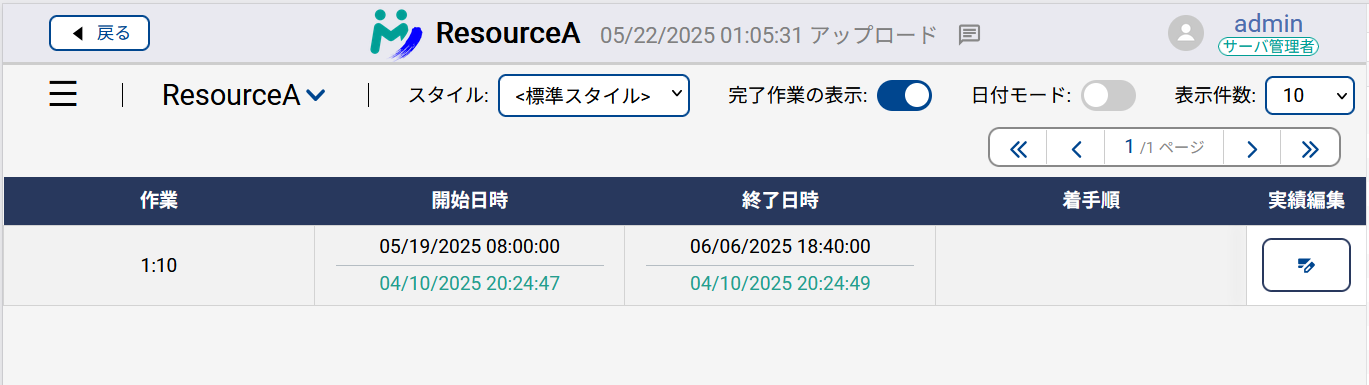
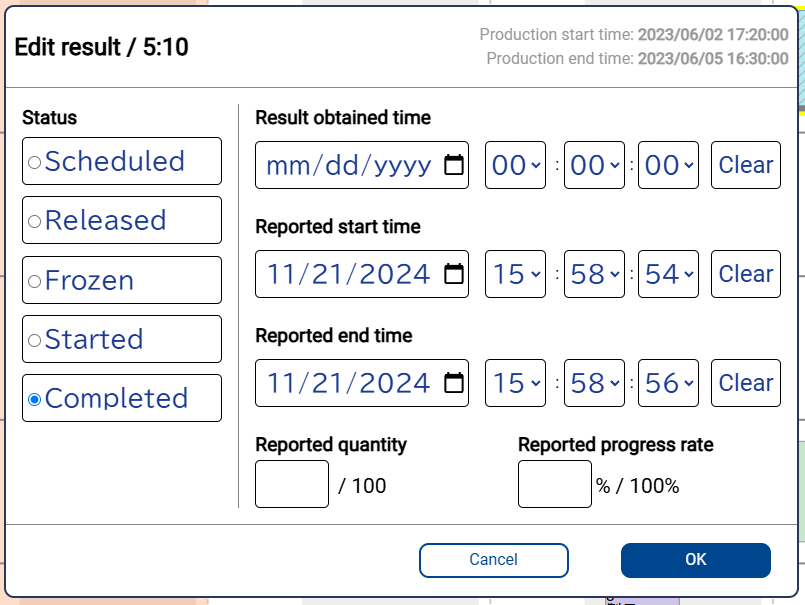
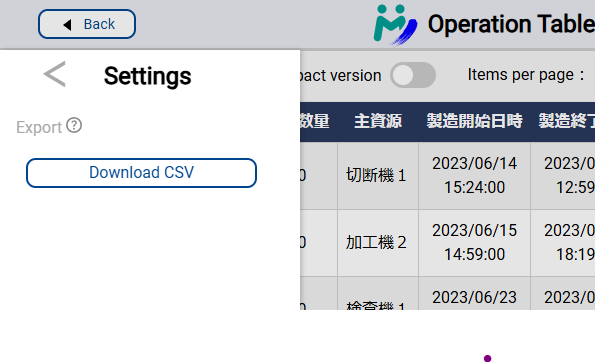
See 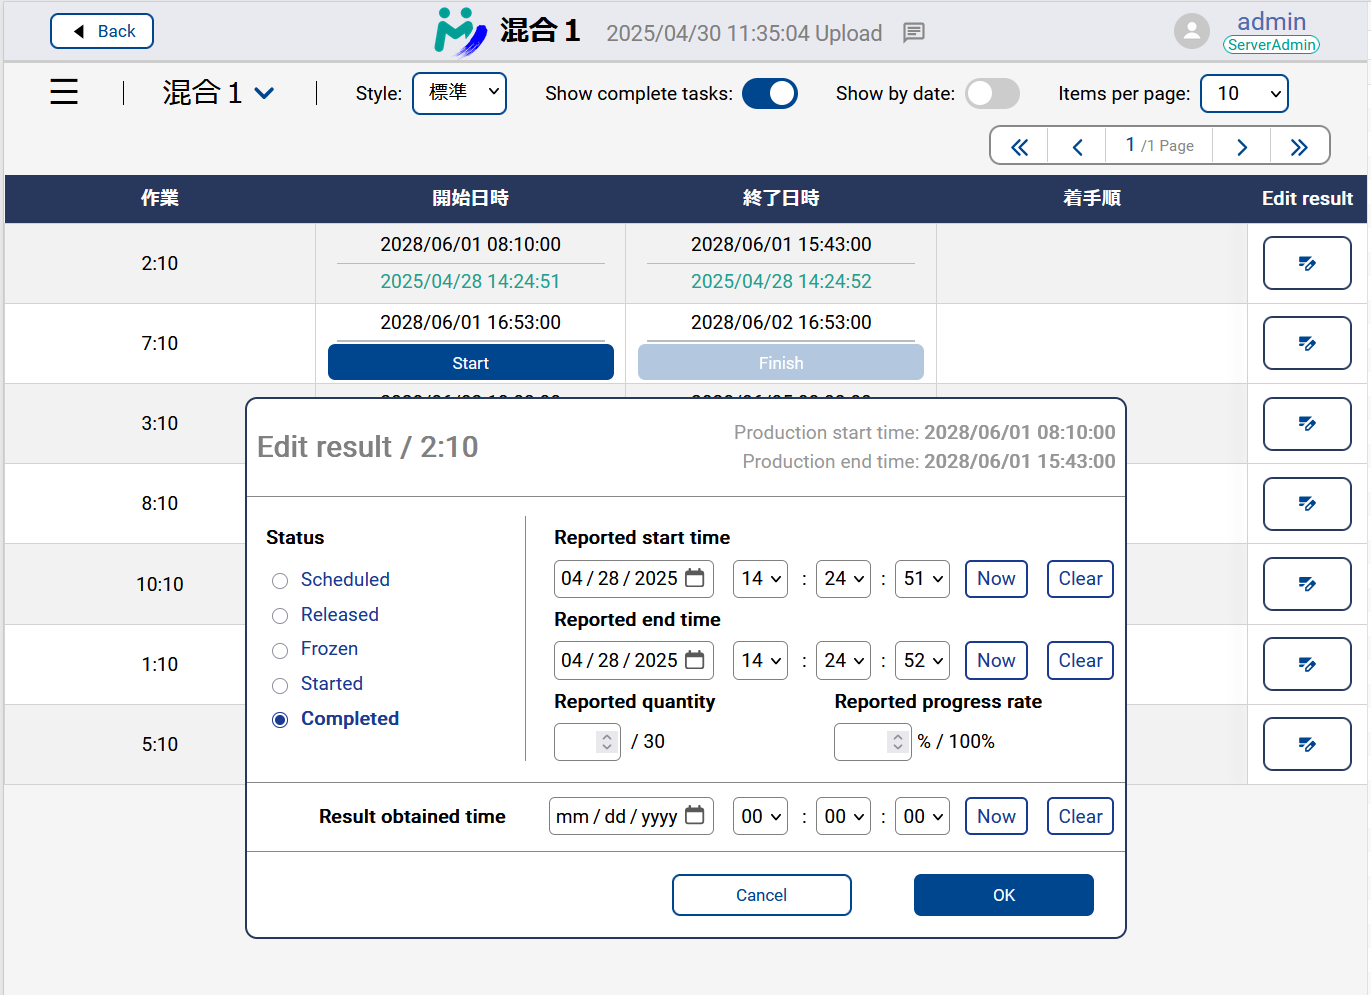 Editing results is now possible on Dispatching View and Operation Table.
Click the buttons on the right-most column to display the edit-results dialog.
Editing results is now possible on Dispatching View and Operation Table.
Click the buttons on the right-most column to display the edit-results dialog.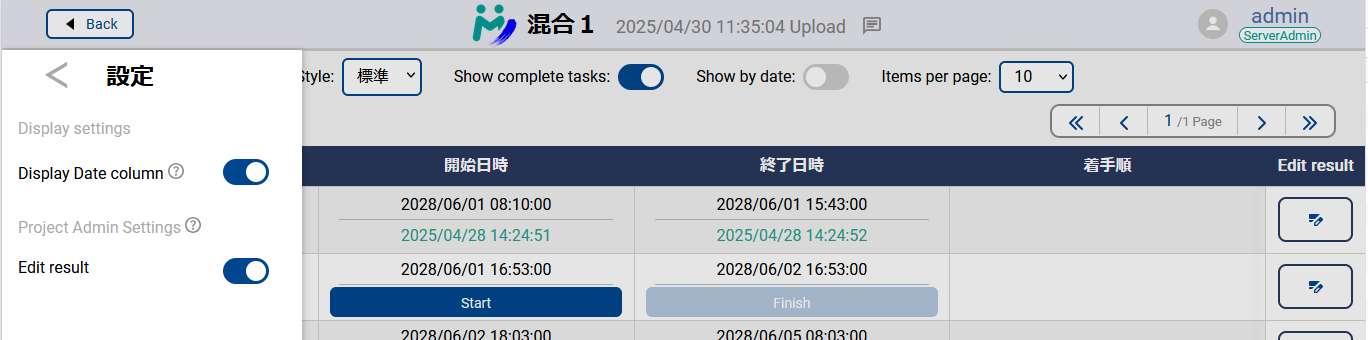 Whether to display the buttons is controlled by the project admins.
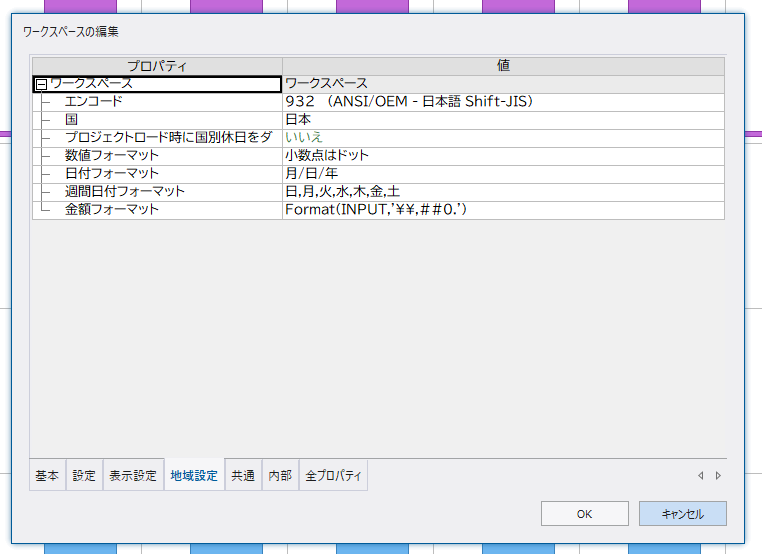
 Dates on My Schedule (especially result obtain time, result start time, result end time) are now formatted by Asprova's date format setting.
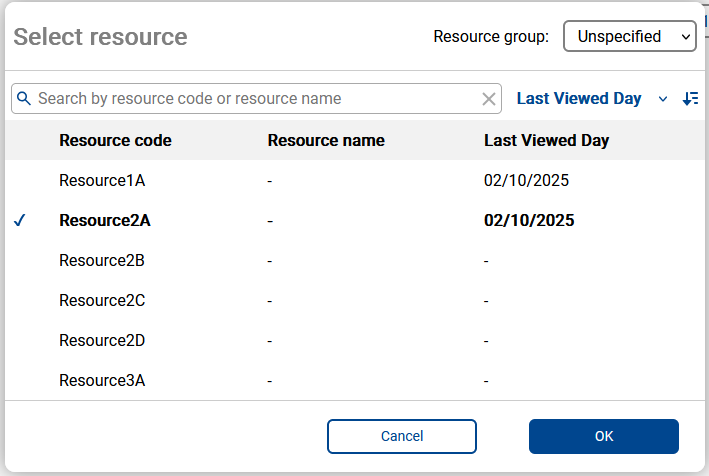
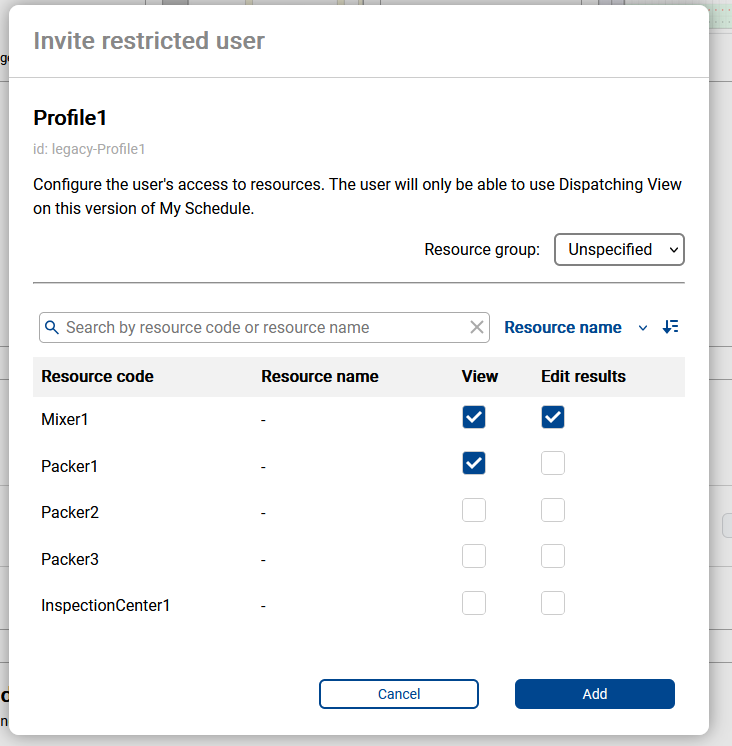 The Restricted Users feature has been added as the first feature to manage the scope of access for each user in My Schedule.
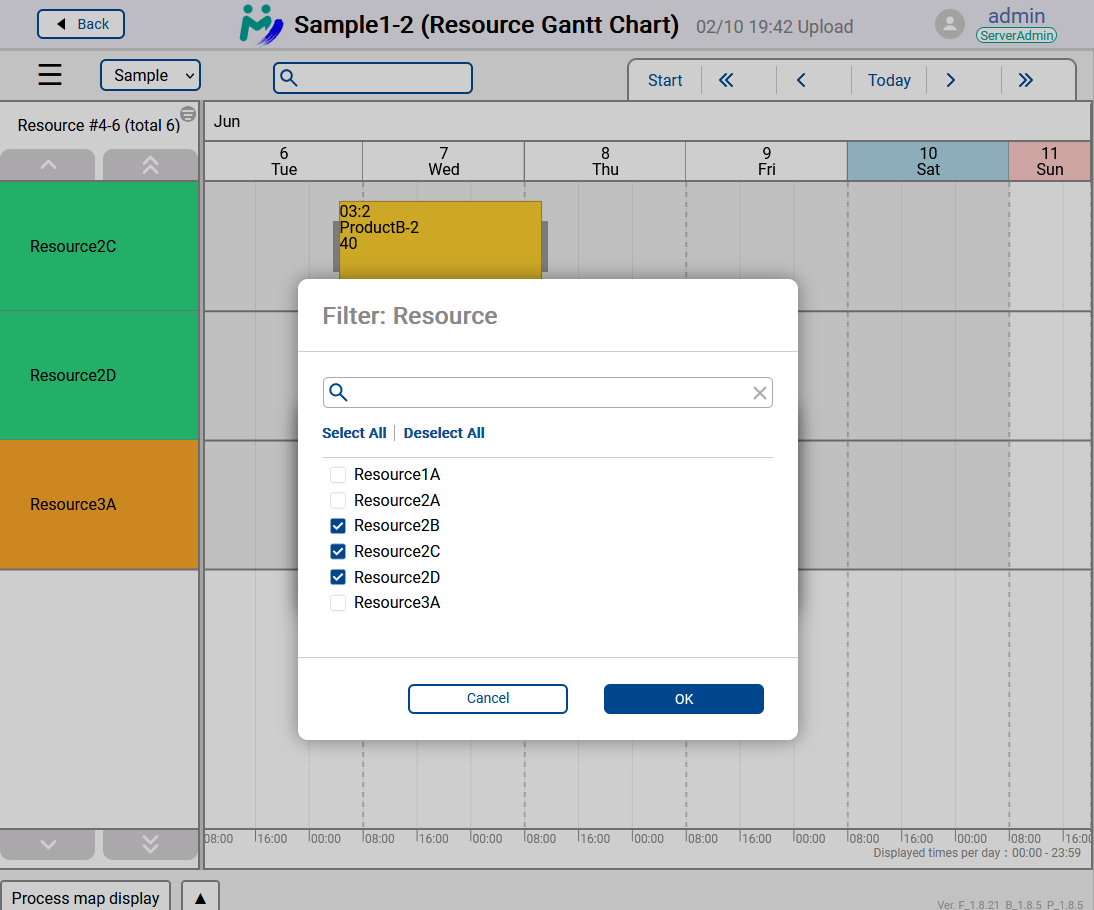
For users set as restricted users, you can select the resources they can access and set the permissions for those resources.
The Restricted Users feature has been added as the first feature to manage the scope of access for each user in My Schedule.
For users set as restricted users, you can select the resources they can access and set the permissions for those resources.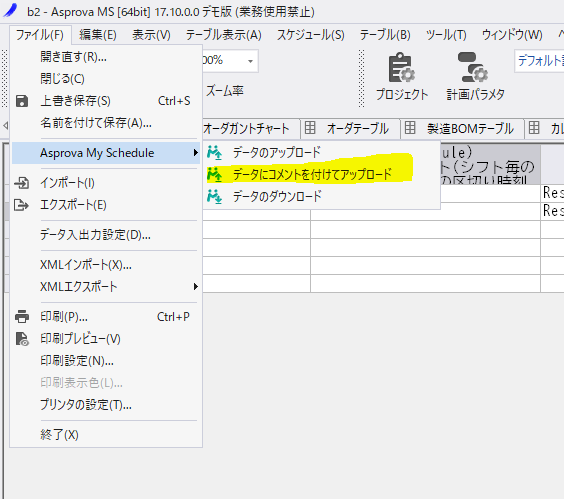 It is now possible to upload from Asprova with comments.
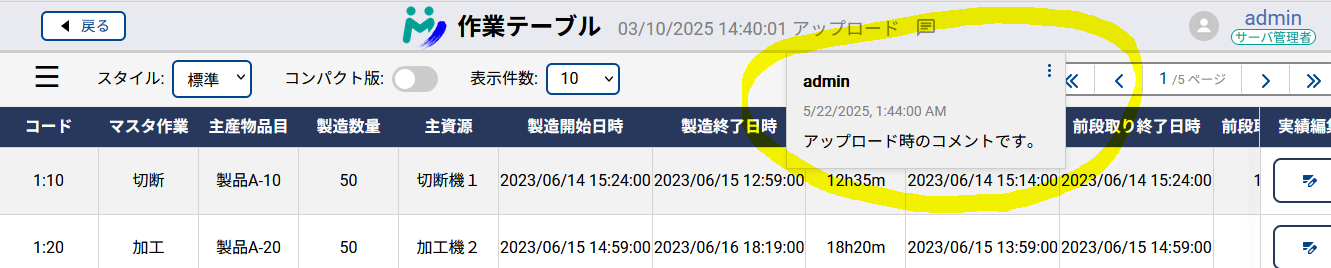 Comments are displayed to My Schedule users in the header.

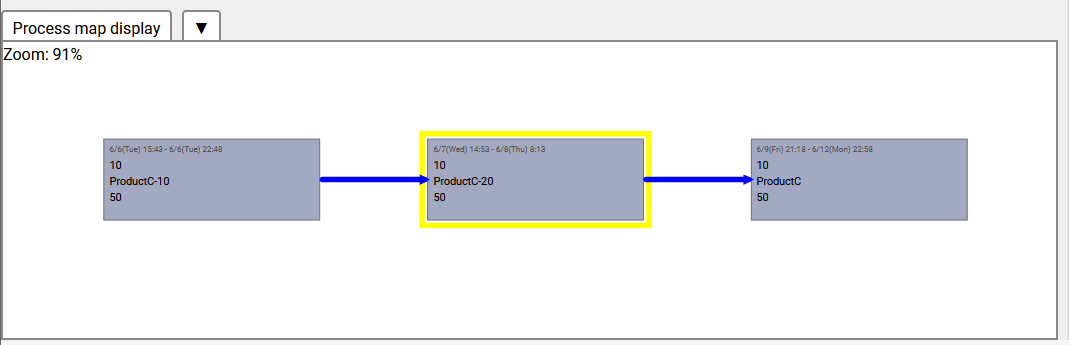 Process Map is a feature that visualizes the connections between processes.
You can access it from the "Process Map Display" at the bottom.
By clicking on a task bar in the Resource Gantt Chart and selecting a task, you can display the series of processes in which that task exists as a graphical map.
Process Map is a feature that visualizes the connections between processes.
You can access it from the "Process Map Display" at the bottom.
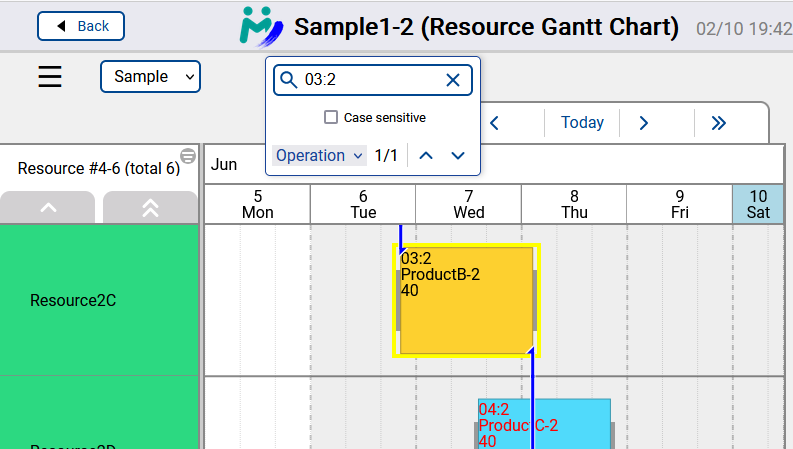
By clicking on a task bar in the Resource Gantt Chart and selecting a task, you can display the series of processes in which that task exists as a graphical map.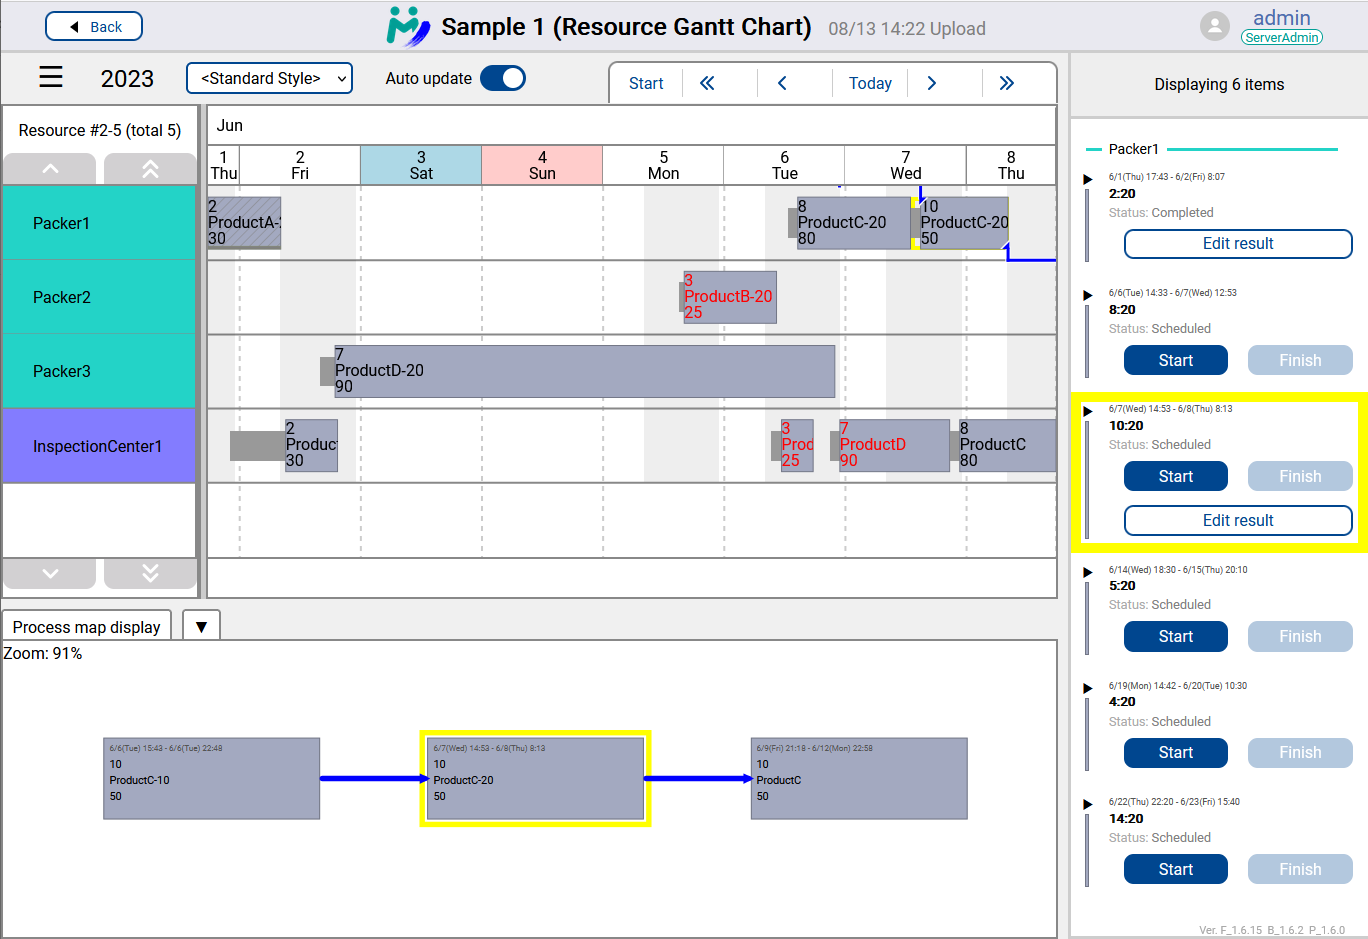 The Gantt Chart section of the Resource Gantt Chart, the timeline display on the right, and the preceding and following process map display are linked. By selecting a task in the preceding and following process map, you can navigate to the corresponding task in the Gantt Chart.
In the image, the yellow frame representing the selected task is visible in the Gantt Chart, timeline display, and preceding and following process map, confirming that the same task is highlighted across all displays.
The Gantt Chart section of the Resource Gantt Chart, the timeline display on the right, and the preceding and following process map display are linked. By selecting a task in the preceding and following process map, you can navigate to the corresponding task in the Gantt Chart.
In the image, the yellow frame representing the selected task is visible in the Gantt Chart, timeline display, and preceding and following process map, confirming that the same task is highlighted across all displays.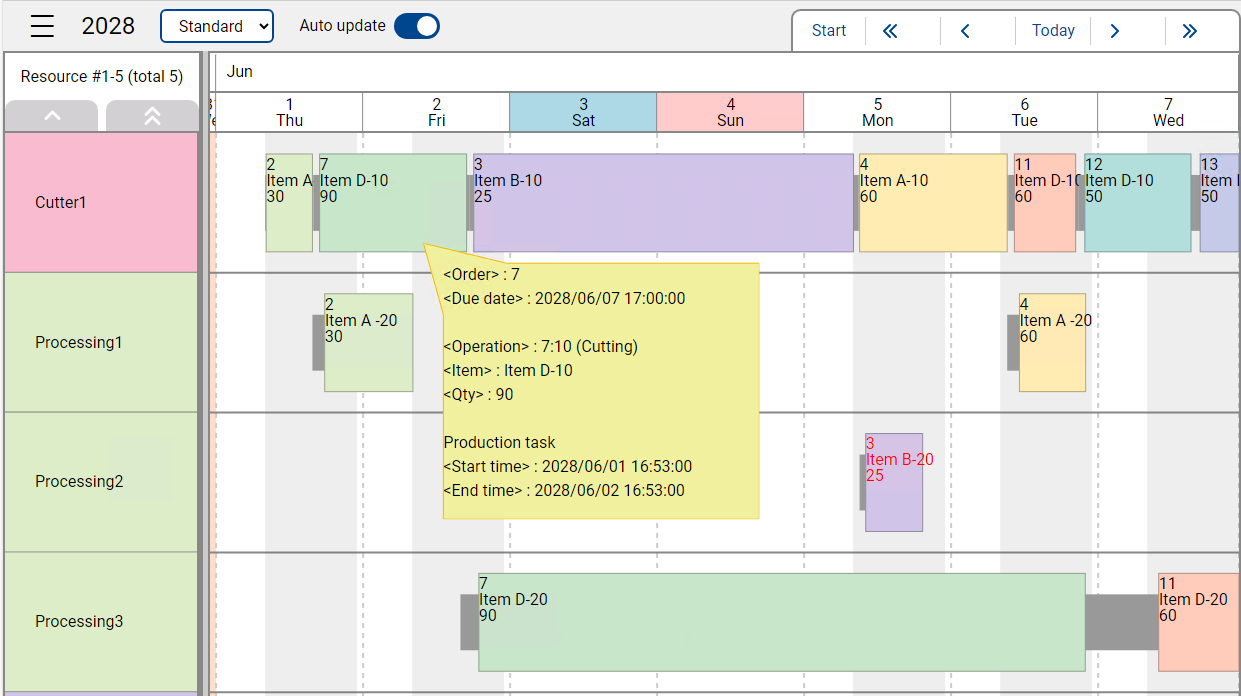 Resource Gantt Chart now supports displaying labels defined in the corresponding style in Asprova.
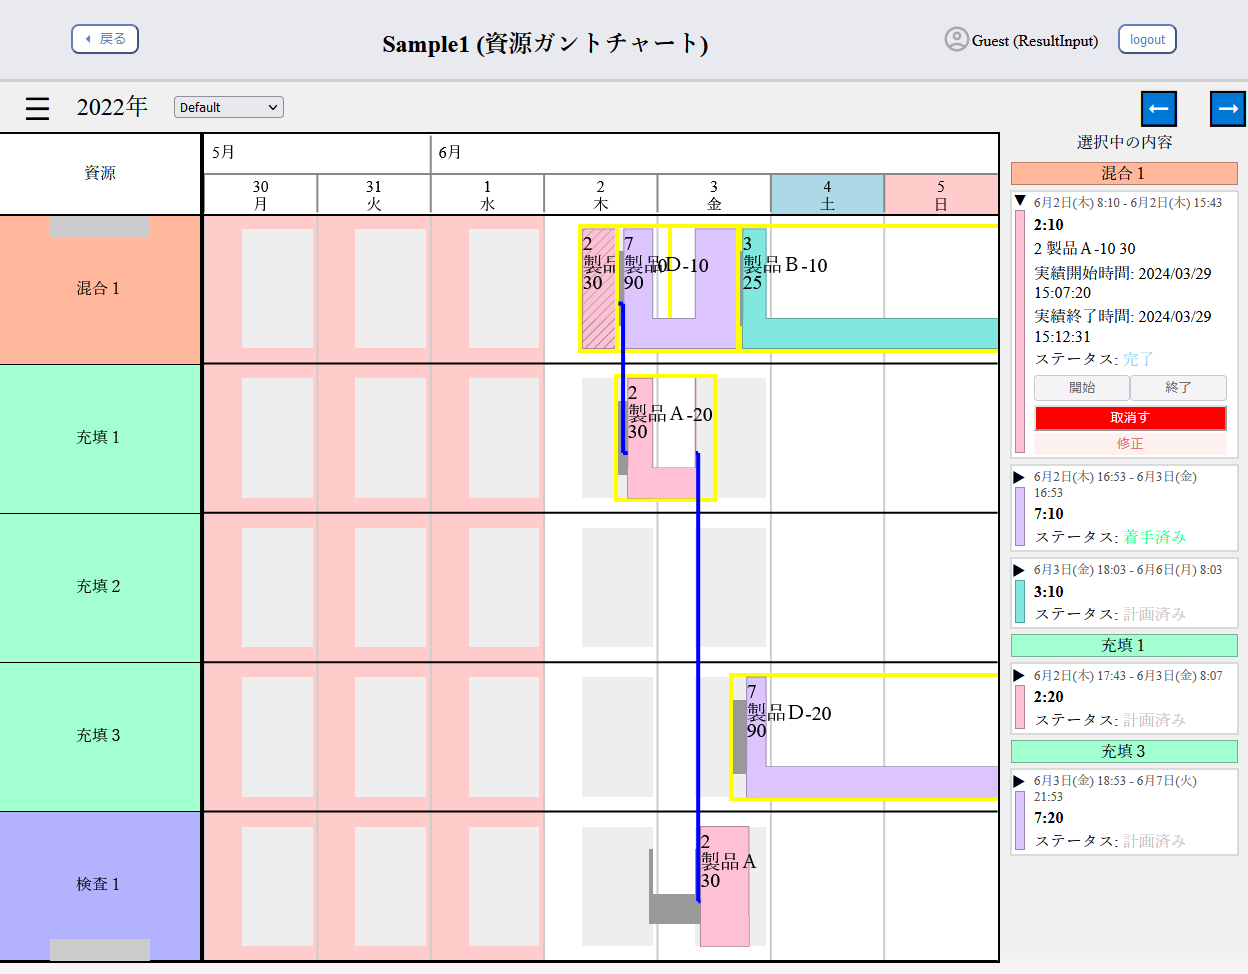
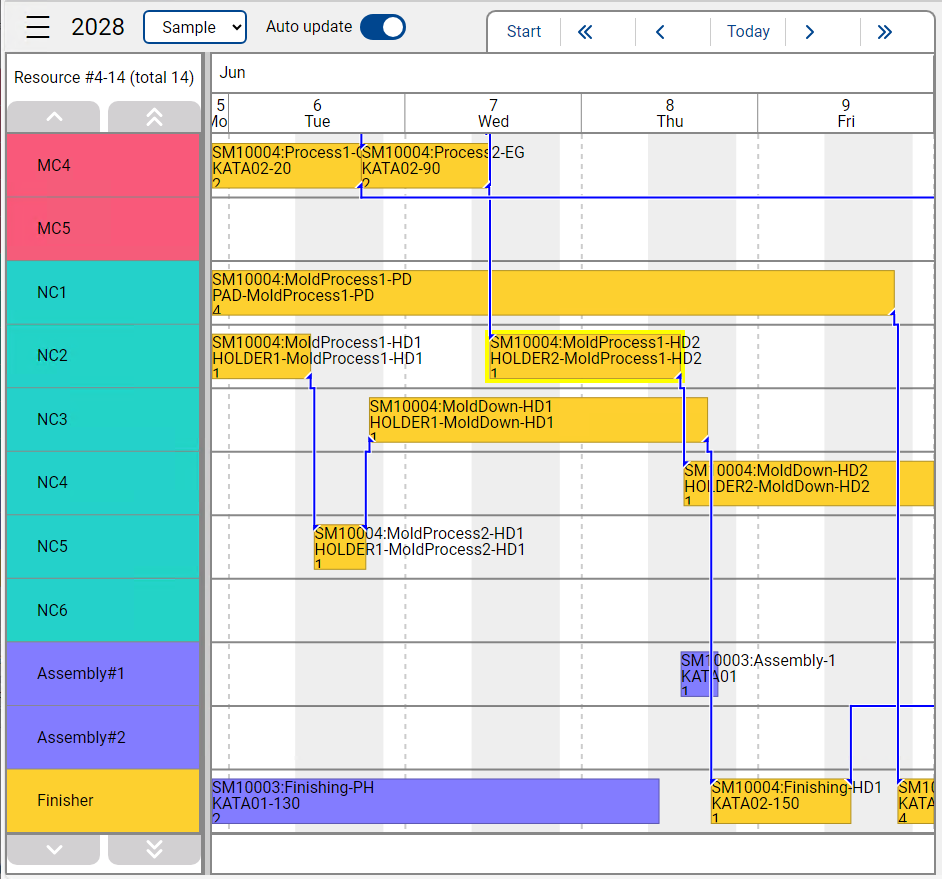 Connection lines on Resource Gantt Chart now has a new look.
Connection lines are drawn by stacking them vertically, and their endpoints now have triangular markers,
which will give users more intuition about the lines' relation with other entities.
Connection lines on Resource Gantt Chart now has a new look.
Connection lines are drawn by stacking them vertically, and their endpoints now have triangular markers,
which will give users more intuition about the lines' relation with other entities.