Ver.1.7
Asprova My Schedule v.1.7 includes an improvement on result inputting and important fixes.
Resource Gantt Chart
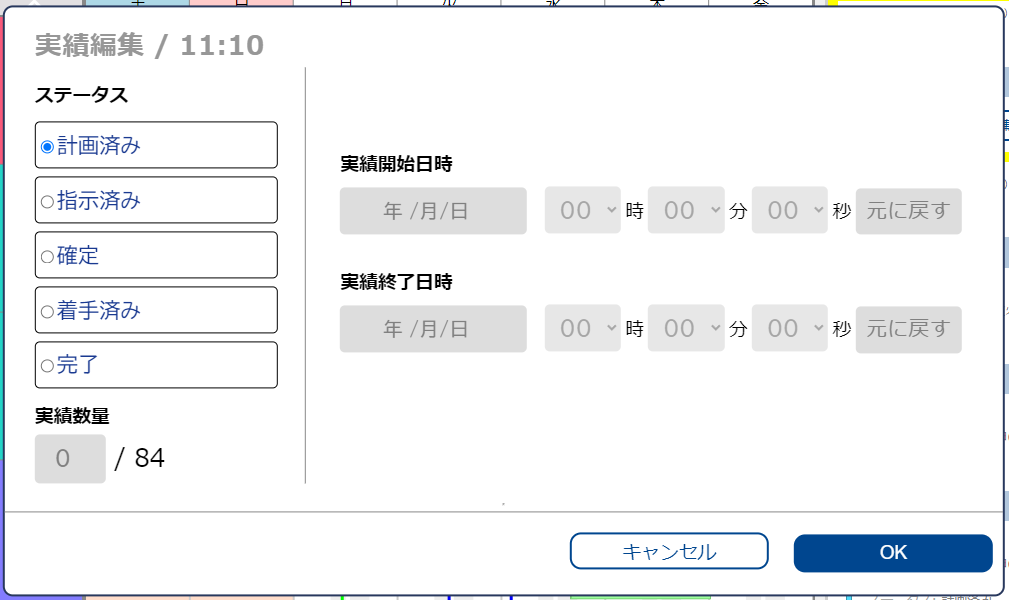
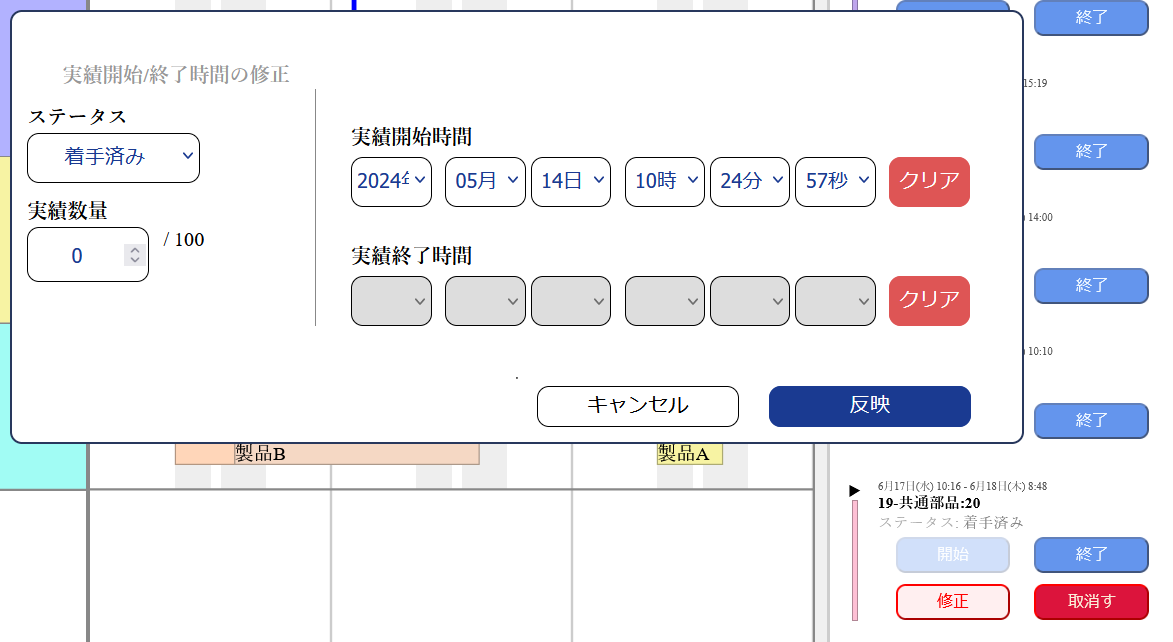
Edit Result Dialog
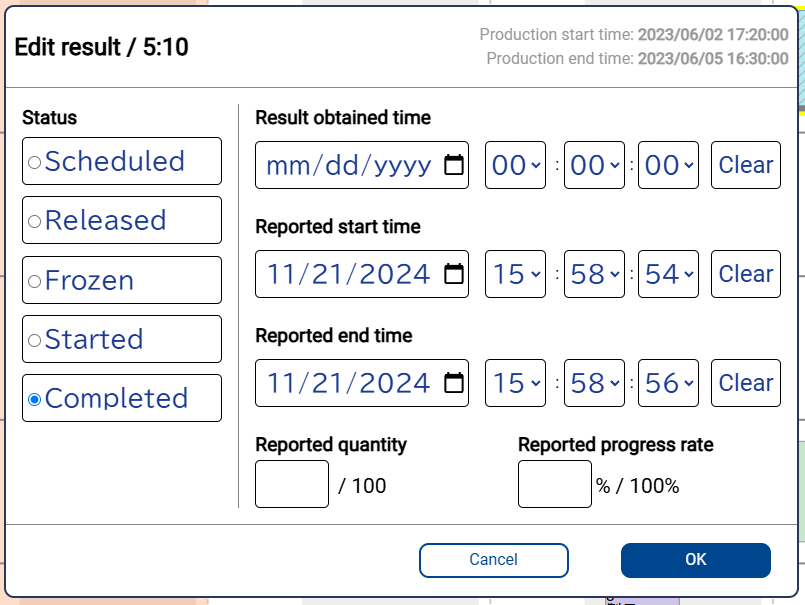
On Resource Gantt Chart's "Edit Result" dialog, added support for "Result Obtain Time" and "Result Progress" properties. This two properties can be set when the operation's status is either "started" or "completed". By setting the status neither of those, properties specific to results, including the those two properties, will be set empty.
As it is on Asprova, when both "Result Quantity" and "Result Progress" are set, the property whose value can be considered having more progress will be treated valid.
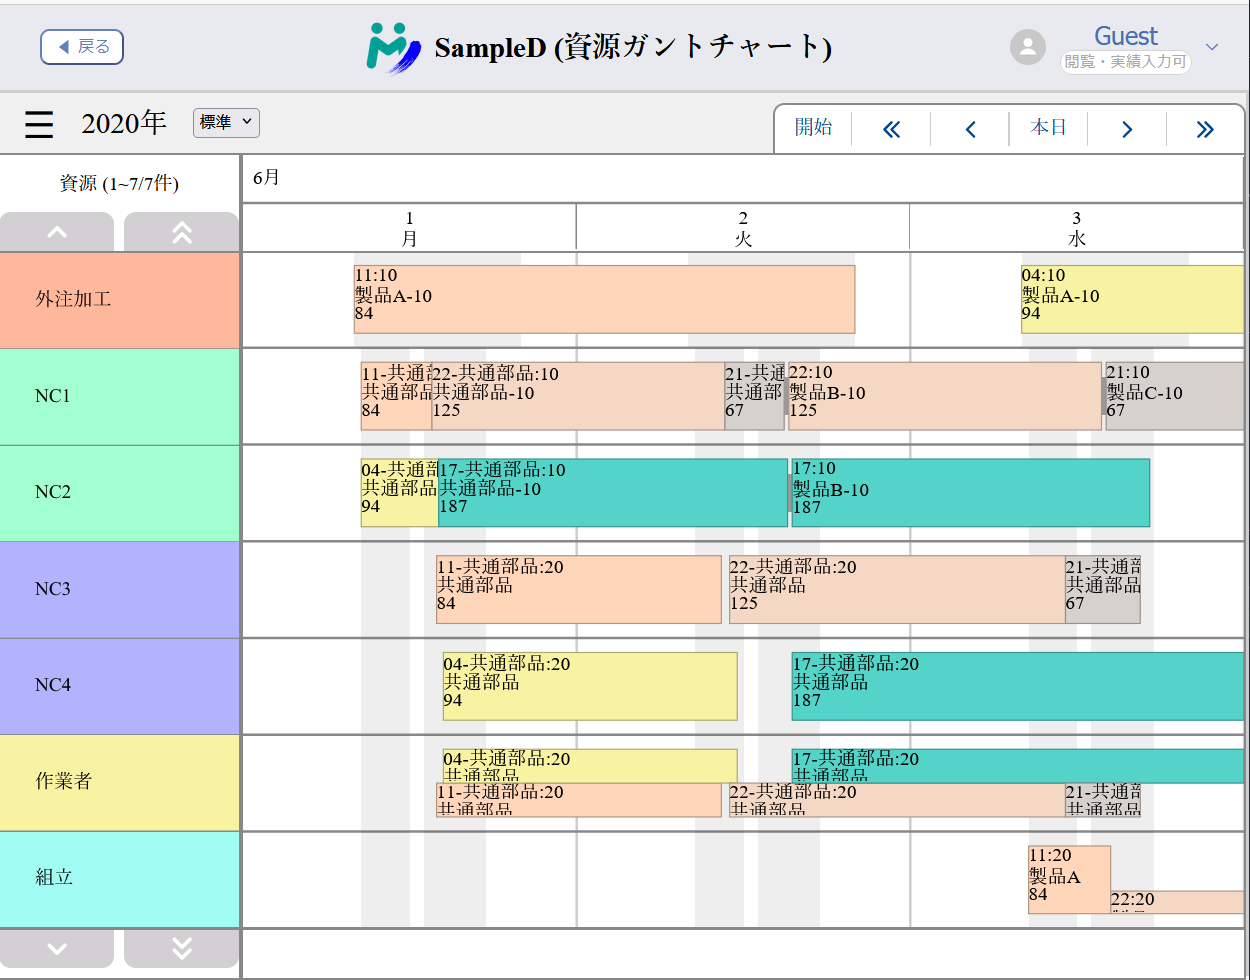
Connection Lines Color
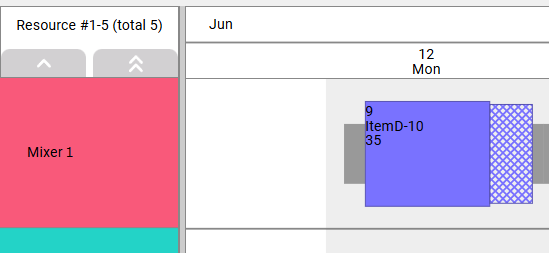
On Resource Gantt Chart, the colors palette of connection lines have been reconsidered. The pegging type "Between orders" (pink) and "Time Constraint" (light blue) now have the same colors as on Asprova. The rendering of connection lines linking sub resources (used to be light green) has also been reconsidered, it is now rendered as dotted lines.
Resource Lock Task
Resource Lock Task are now rendered on My Schedule.
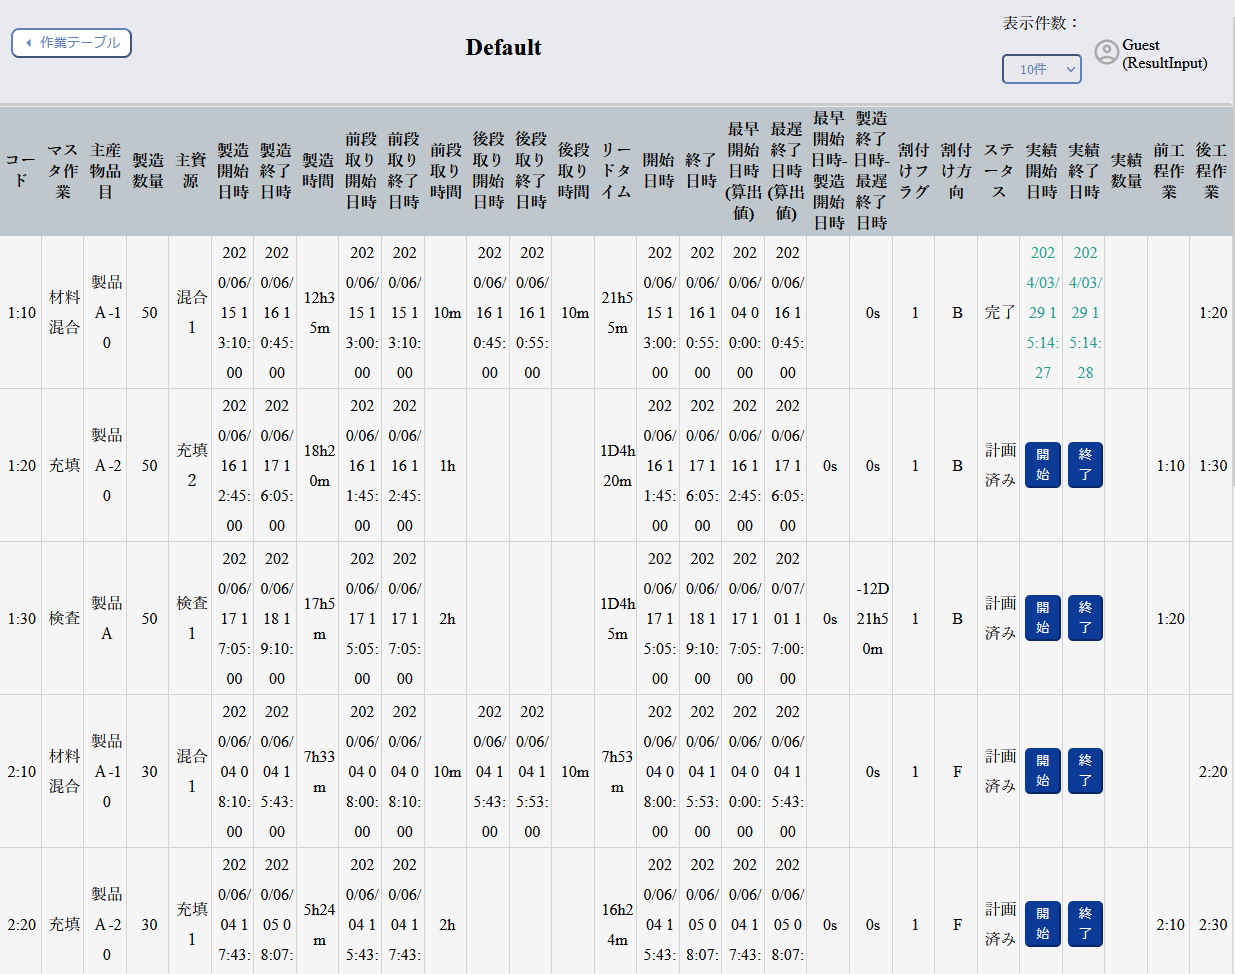
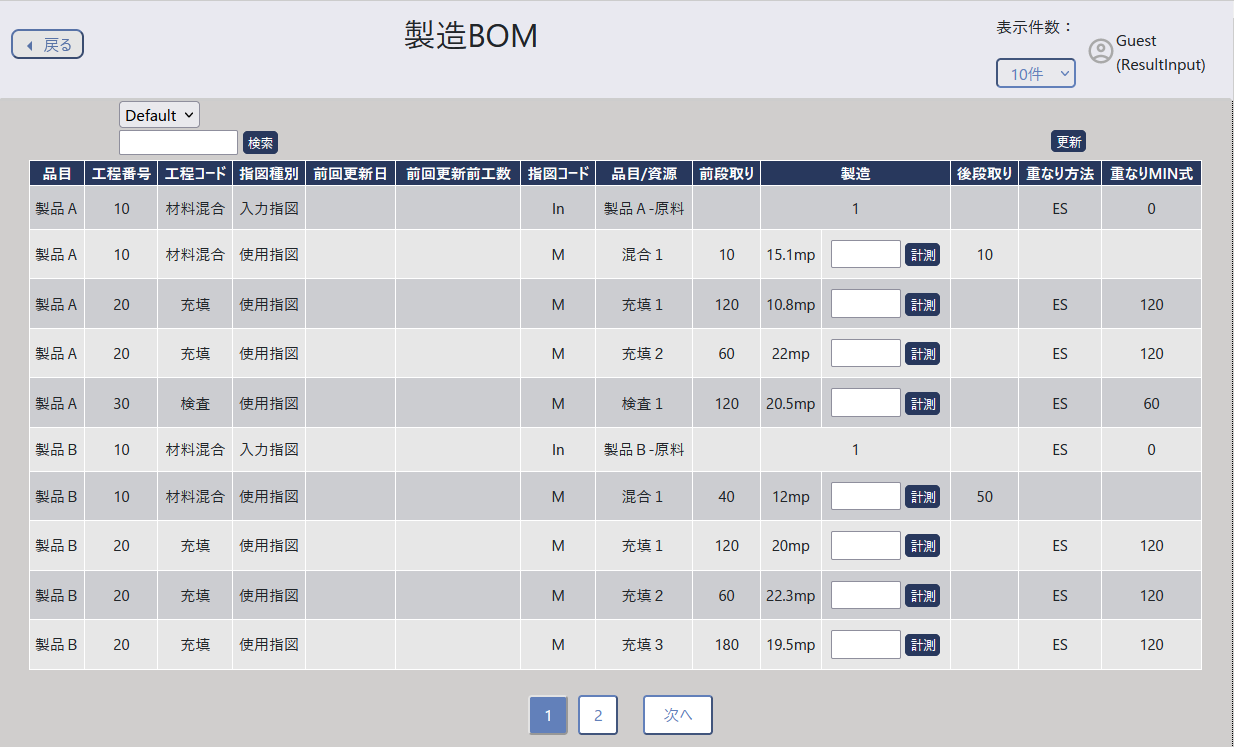
Operation Table
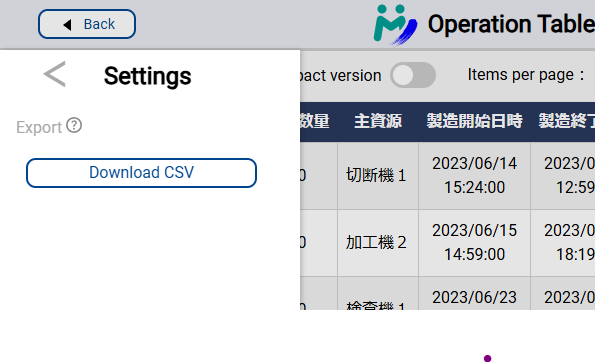
We added a functionality by which users can download the content on the Operation Table in csv format. By opening the menu with the hamburger button on top right and clicking on "Export as csv" button, users can download all the operations belonging to the selected style in csv format (Excel compatible).
We also removed the style selection screen of Operation Table. Styles can now be selected by the combobox on the top.
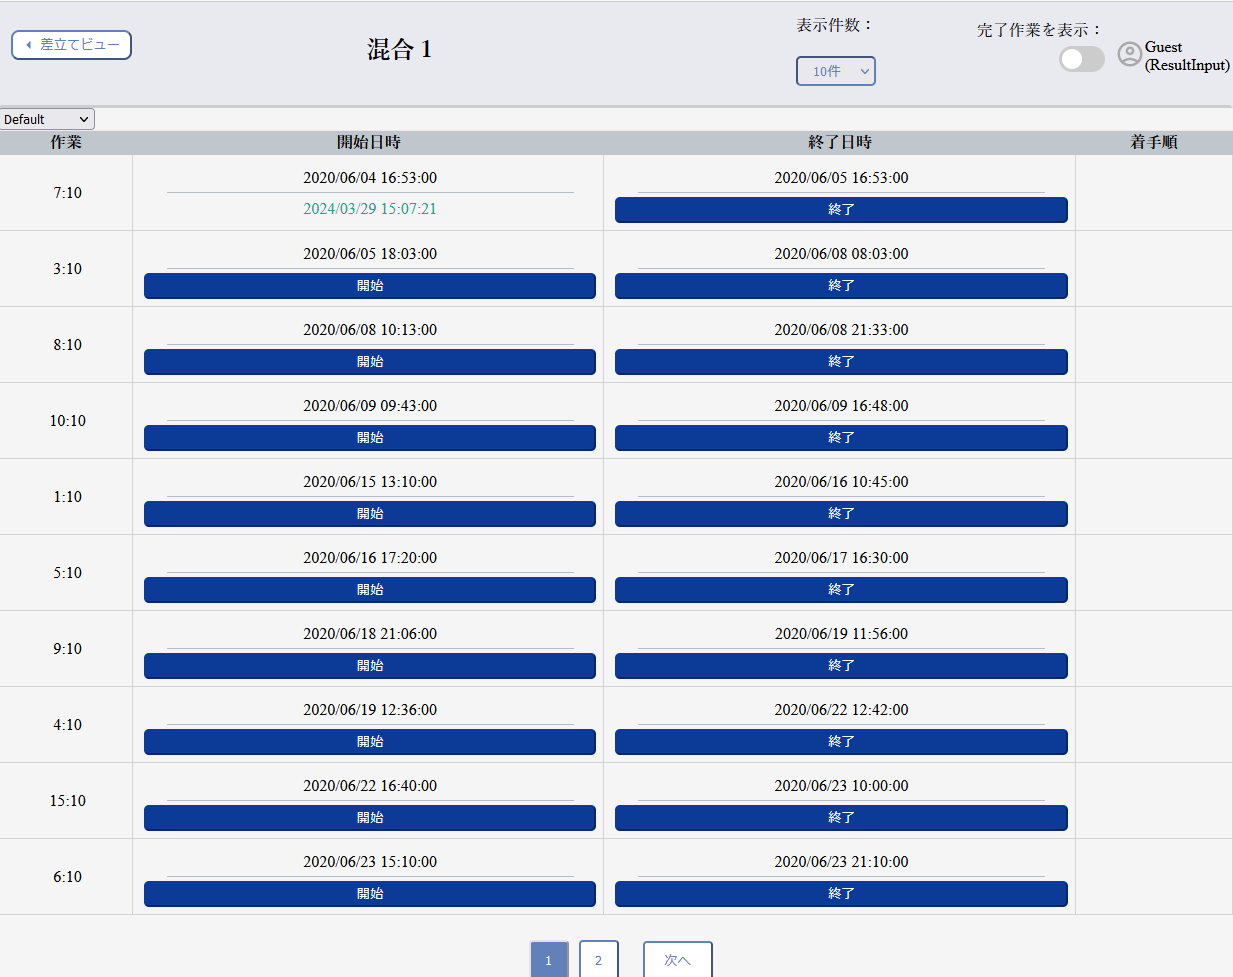
Dispatching View
On Dispatching View's resource selection screen, resources that are not relevant in any uploaded style now are not shown.
Plus, Dispatching View now automatically updates the operations shown when a result is input on other devices or when the project data gets re-uploaded from the Plugin.
Other minor improvements and fixes
- Fixed a problem in which time constraint methods were not correctly displayed on the Resource Gantt Chart when time constraint methods were set for both input and use instructions.
- Fixed a problem in which entered results were not reflected correctly on the front-end side under certain conditions.
- Fixed a bug in the Edit Result dialog that allowed cases where the result start time was later than the result end time.
- Fixed a bug in the Gantt chart where clicking the “Today” button in the upper right corner jumps to the current time instead of the beginning of the day
- Fixed a bug that when updating My Schedule to a newer version, the browser cache kept showing the older version.
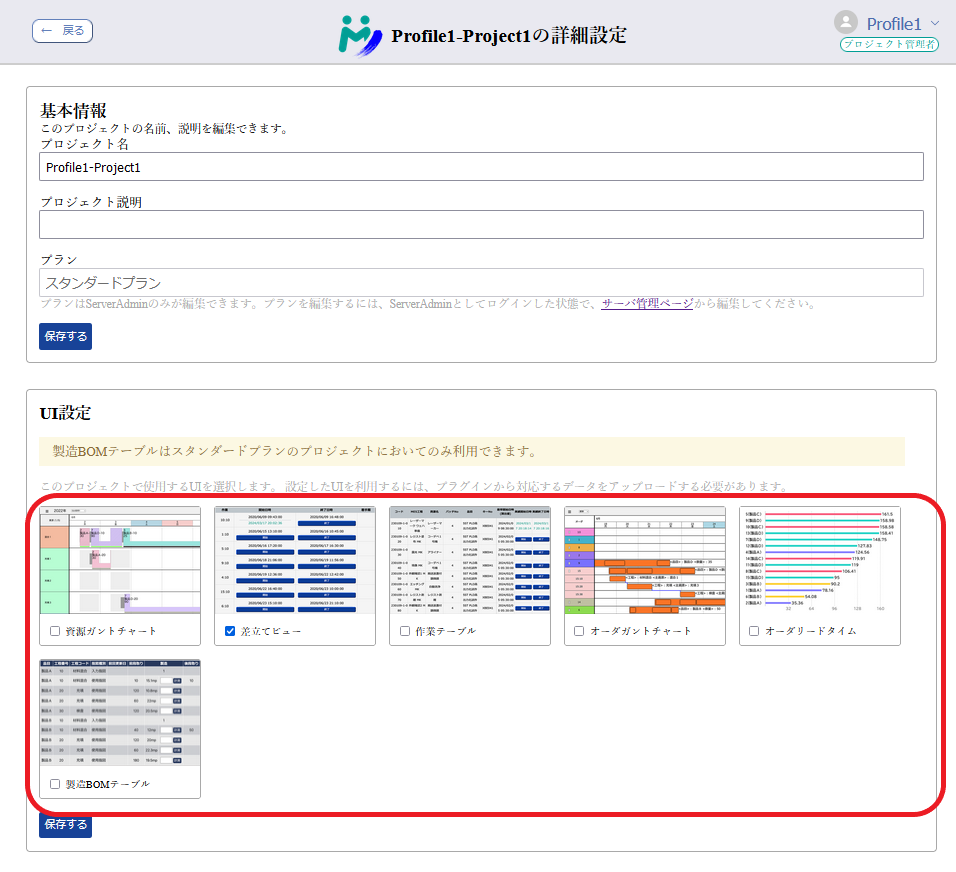
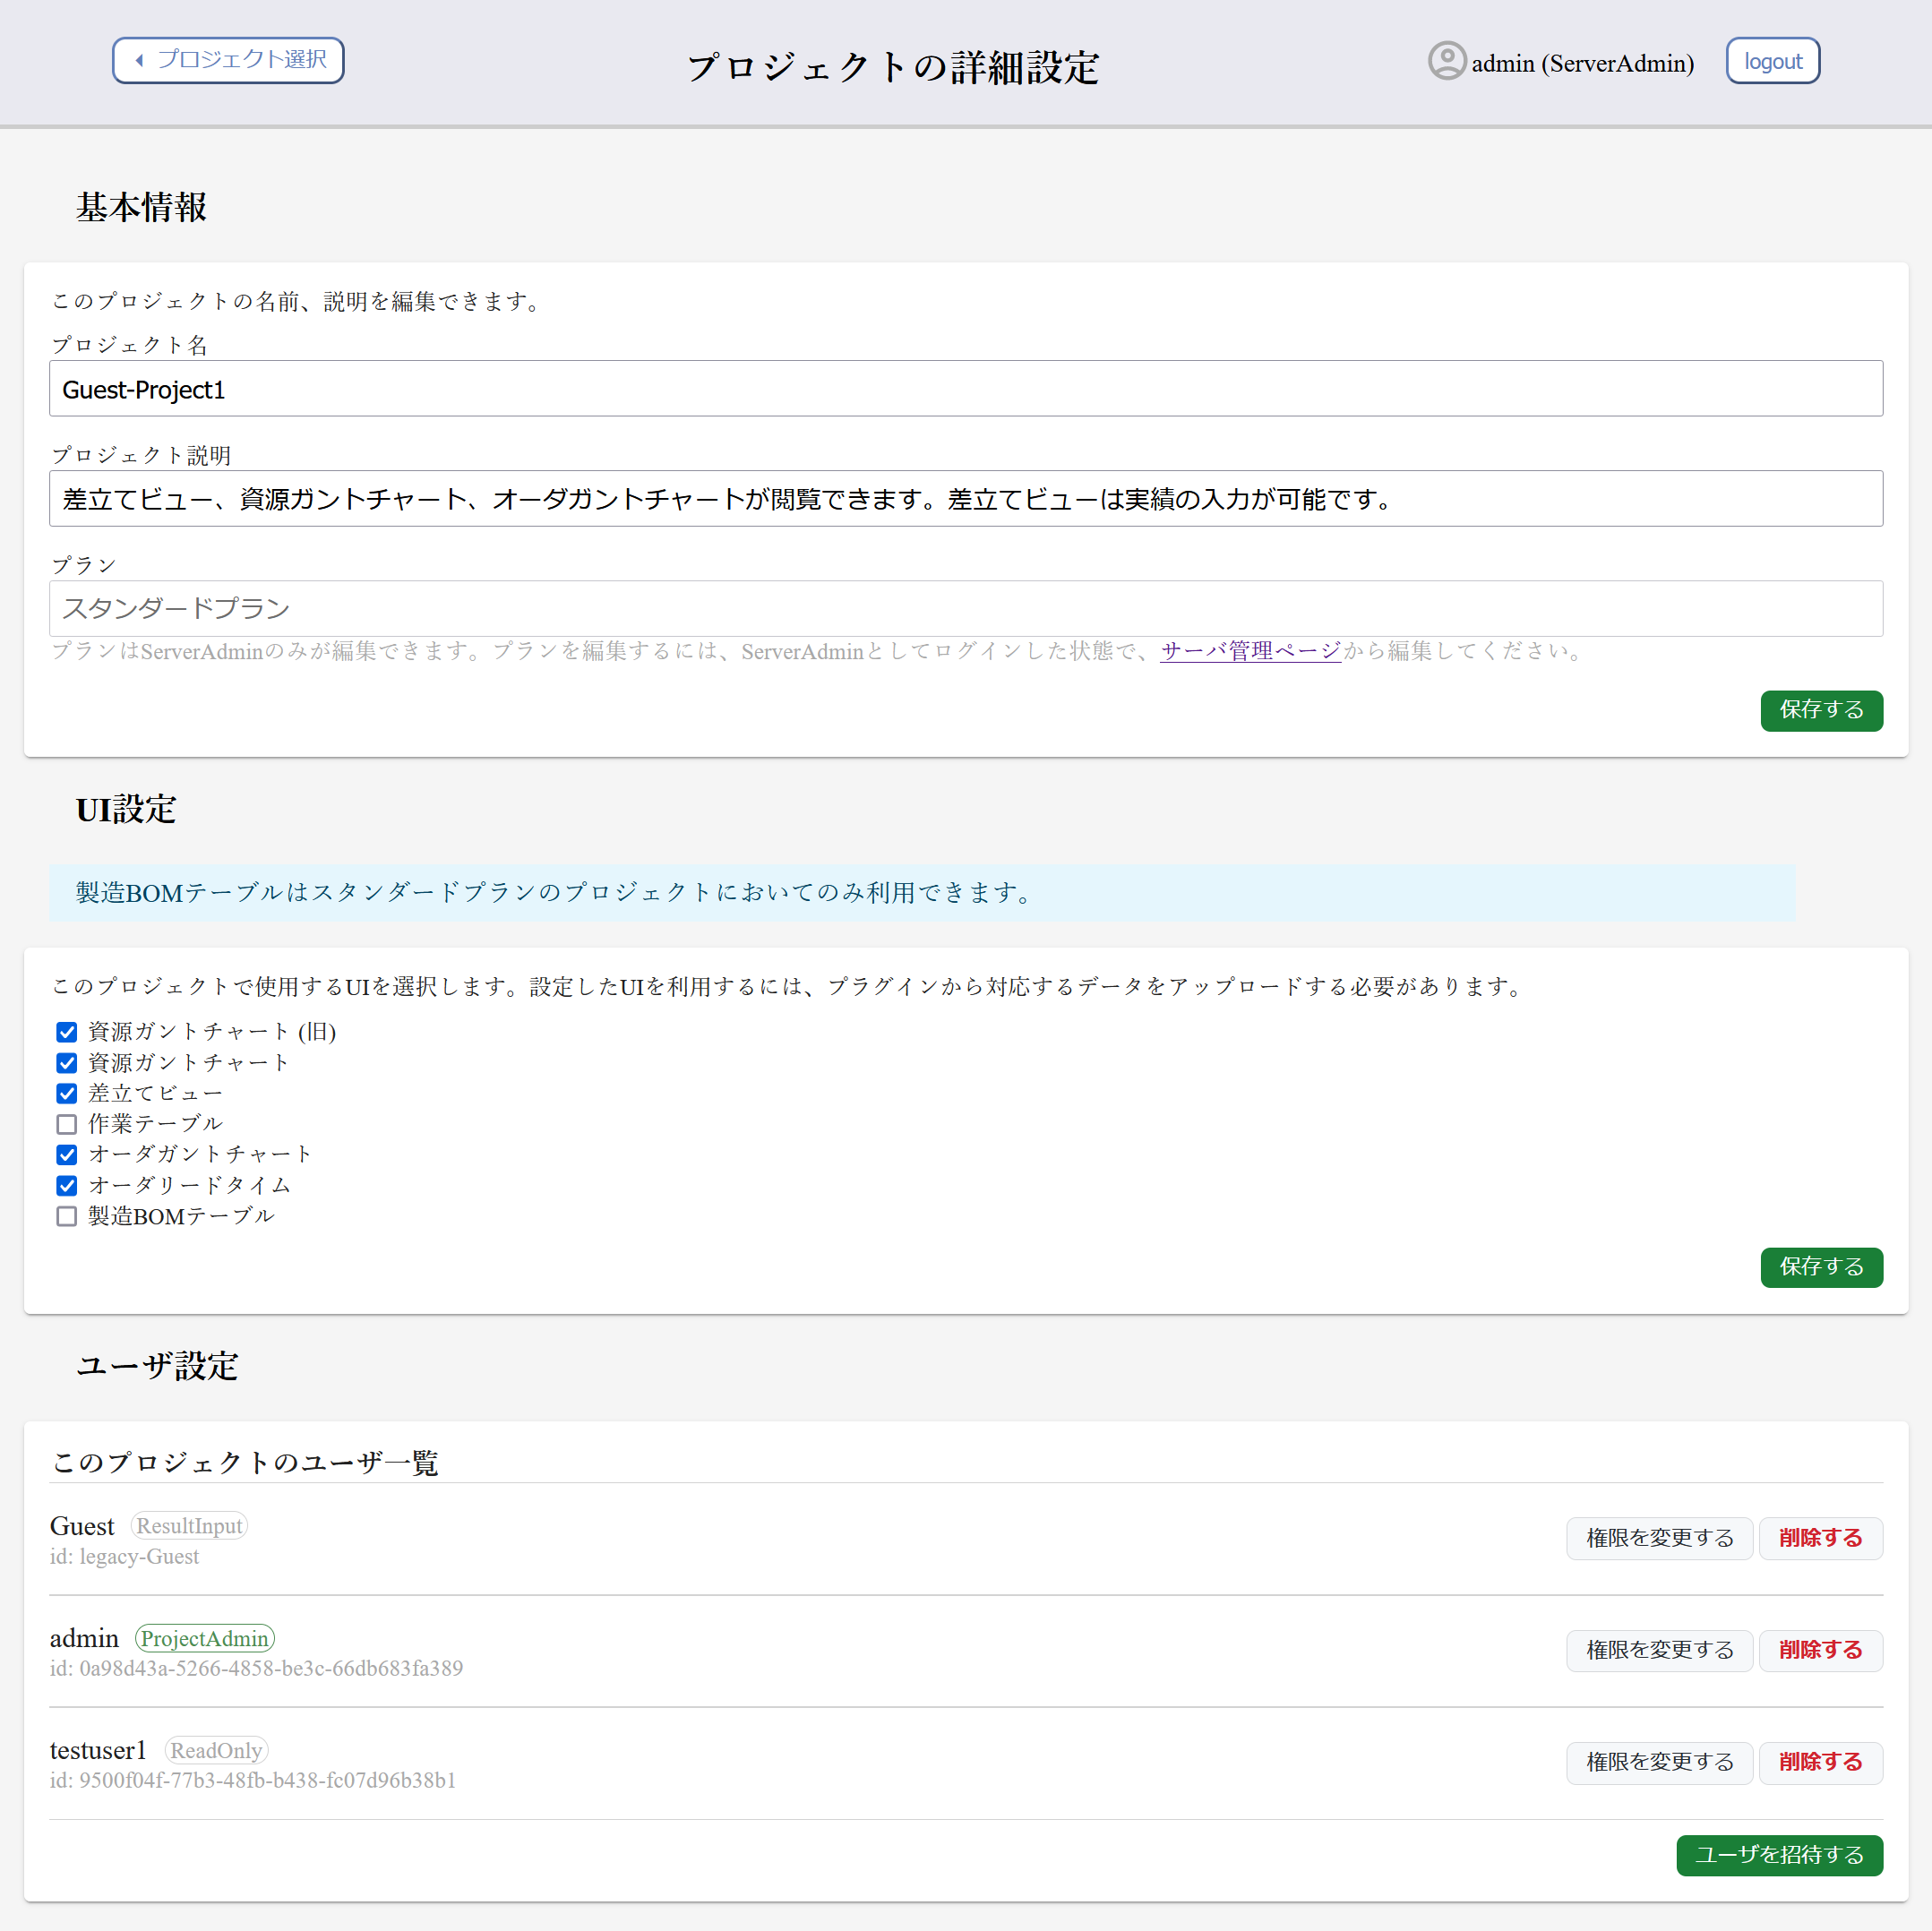
- Moved the Delete results button to the project's Advanced Settings page. It is no longer possible to delete results from Dispatching View or Operation Table.
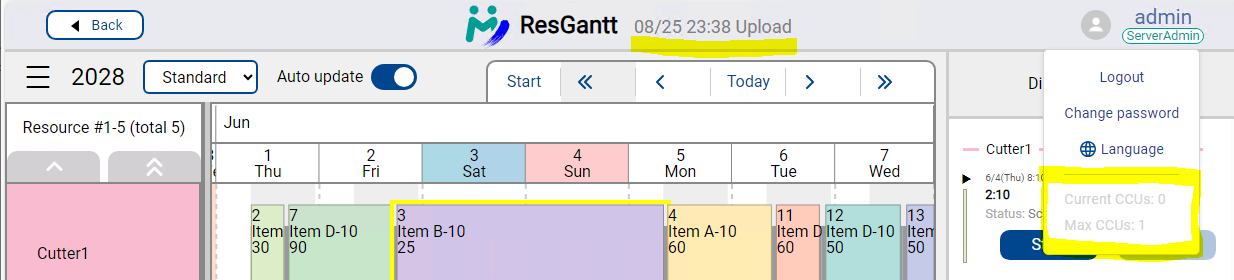
- Changed behavior regarding concurrent connections so that when logging out, the connection used at the time gets released. It used to be kept counted in the number of concurrent connections until 15 minutes had elapsed.
- Fixed a problem in which the number of concurrent connections was counted multiply under certain conditions.
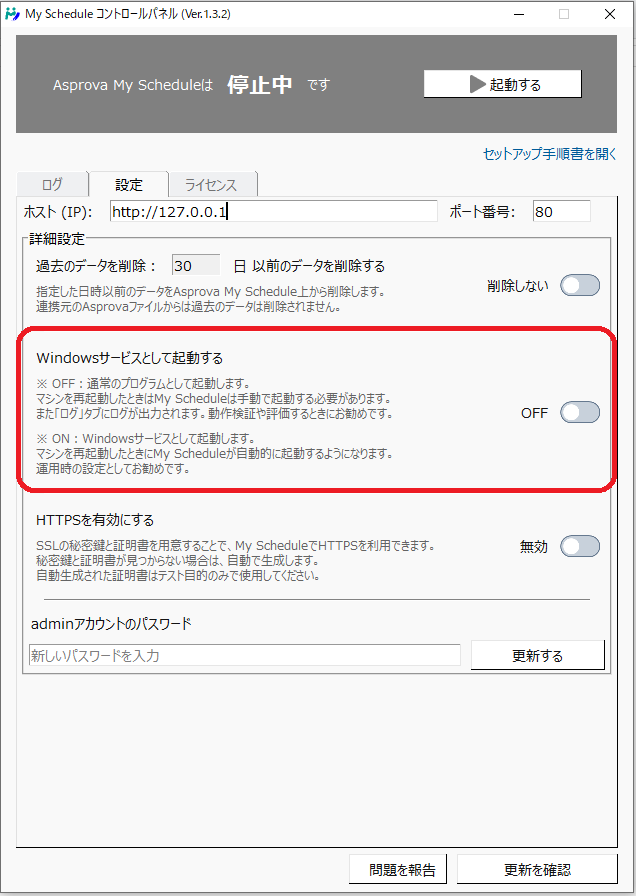
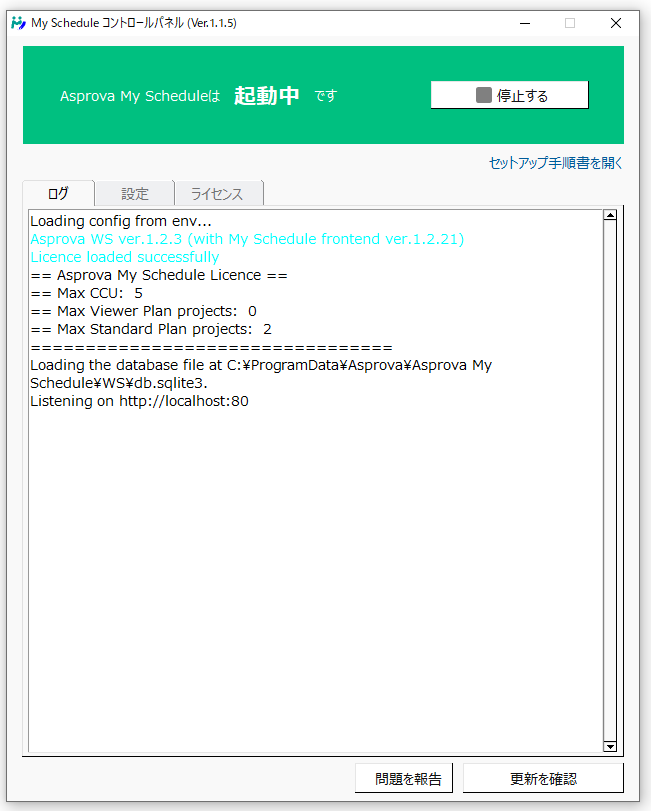
- Fixed a problem in which when the control panel was opened for the first time, its window popped out of the screen.
- Fixed a problem in which the control panel would falsely display "success" when an attempt to change the password for the administrator account failed.
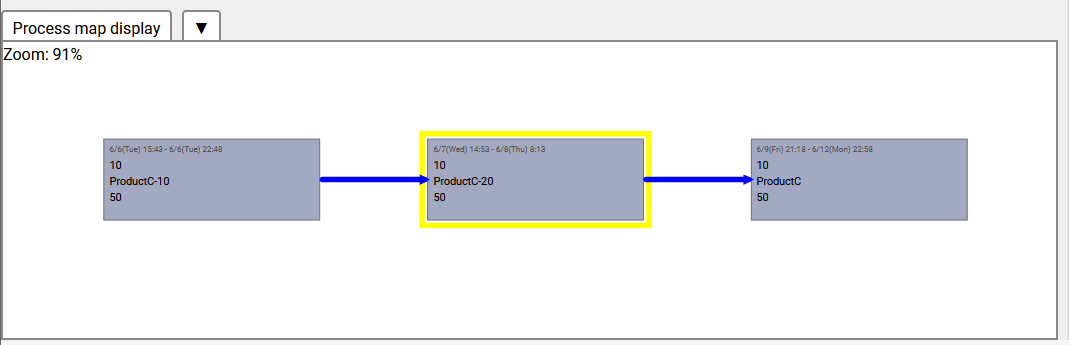 Process Map is a feature that visualizes the connections between processes.
You can access it from the "Process Map Display" at the bottom.
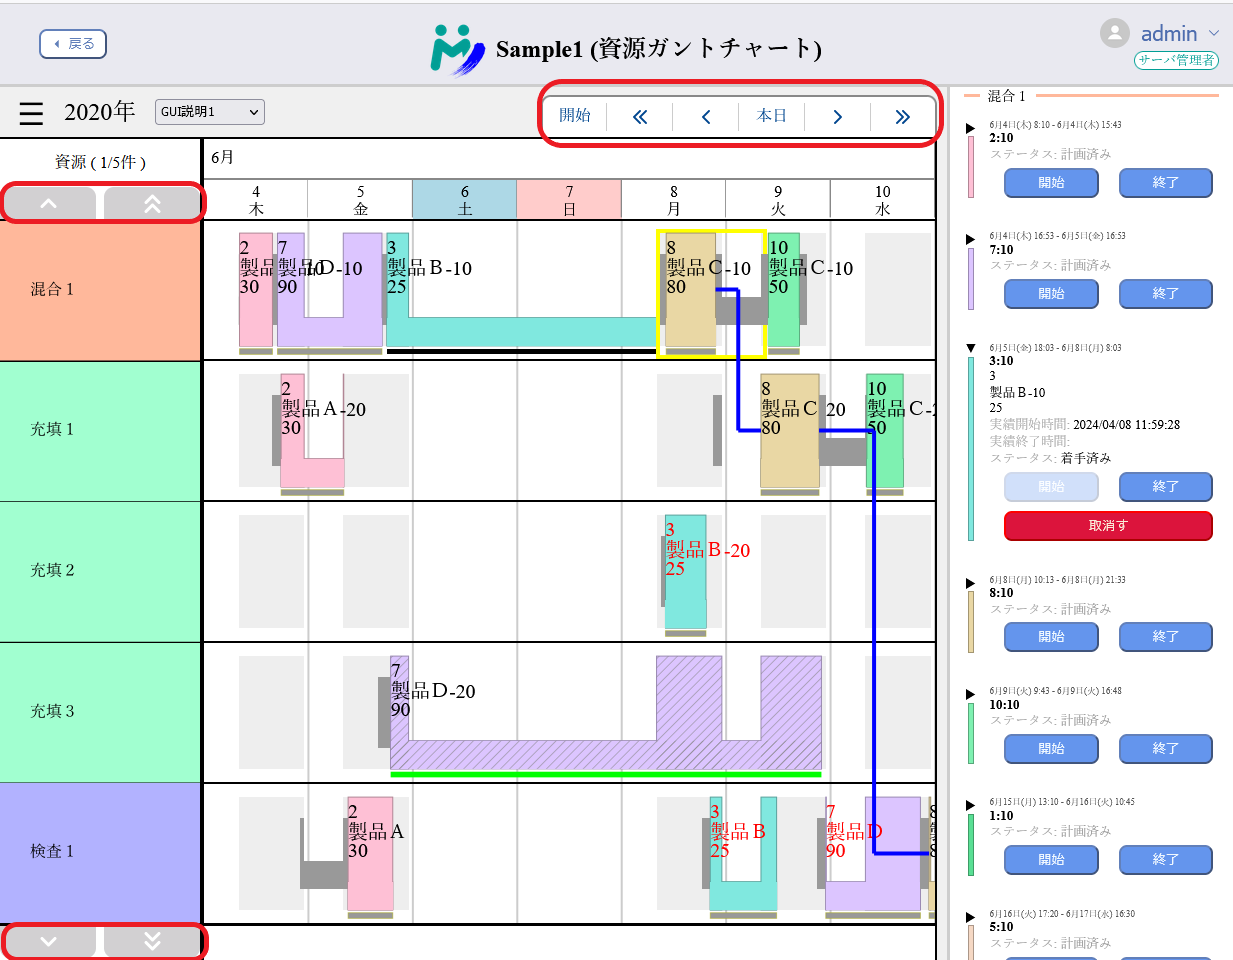
By clicking on a task bar in the Resource Gantt Chart and selecting a task, you can display the series of processes in which that task exists as a graphical map.
Process Map is a feature that visualizes the connections between processes.
You can access it from the "Process Map Display" at the bottom.
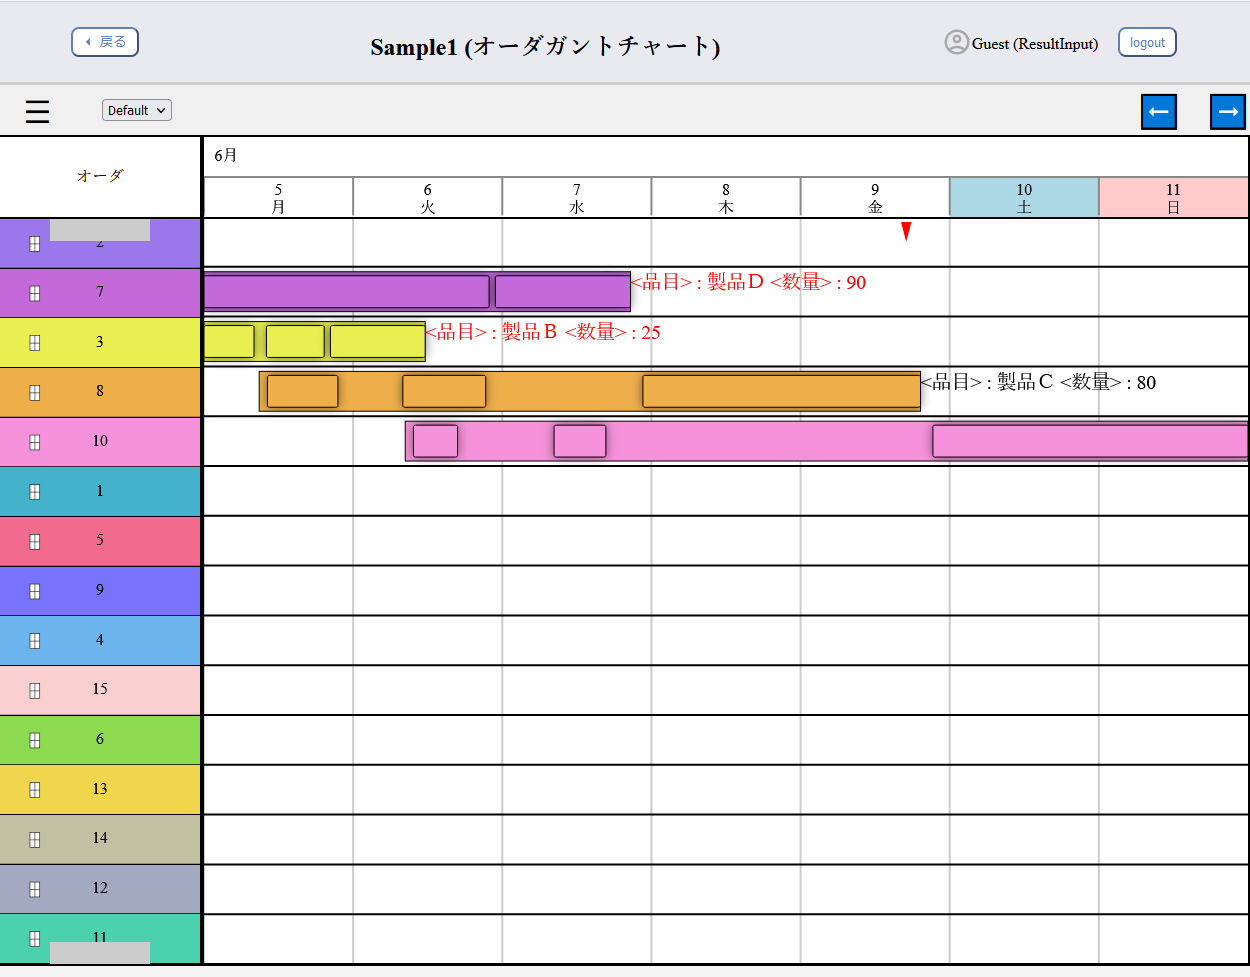
By clicking on a task bar in the Resource Gantt Chart and selecting a task, you can display the series of processes in which that task exists as a graphical map.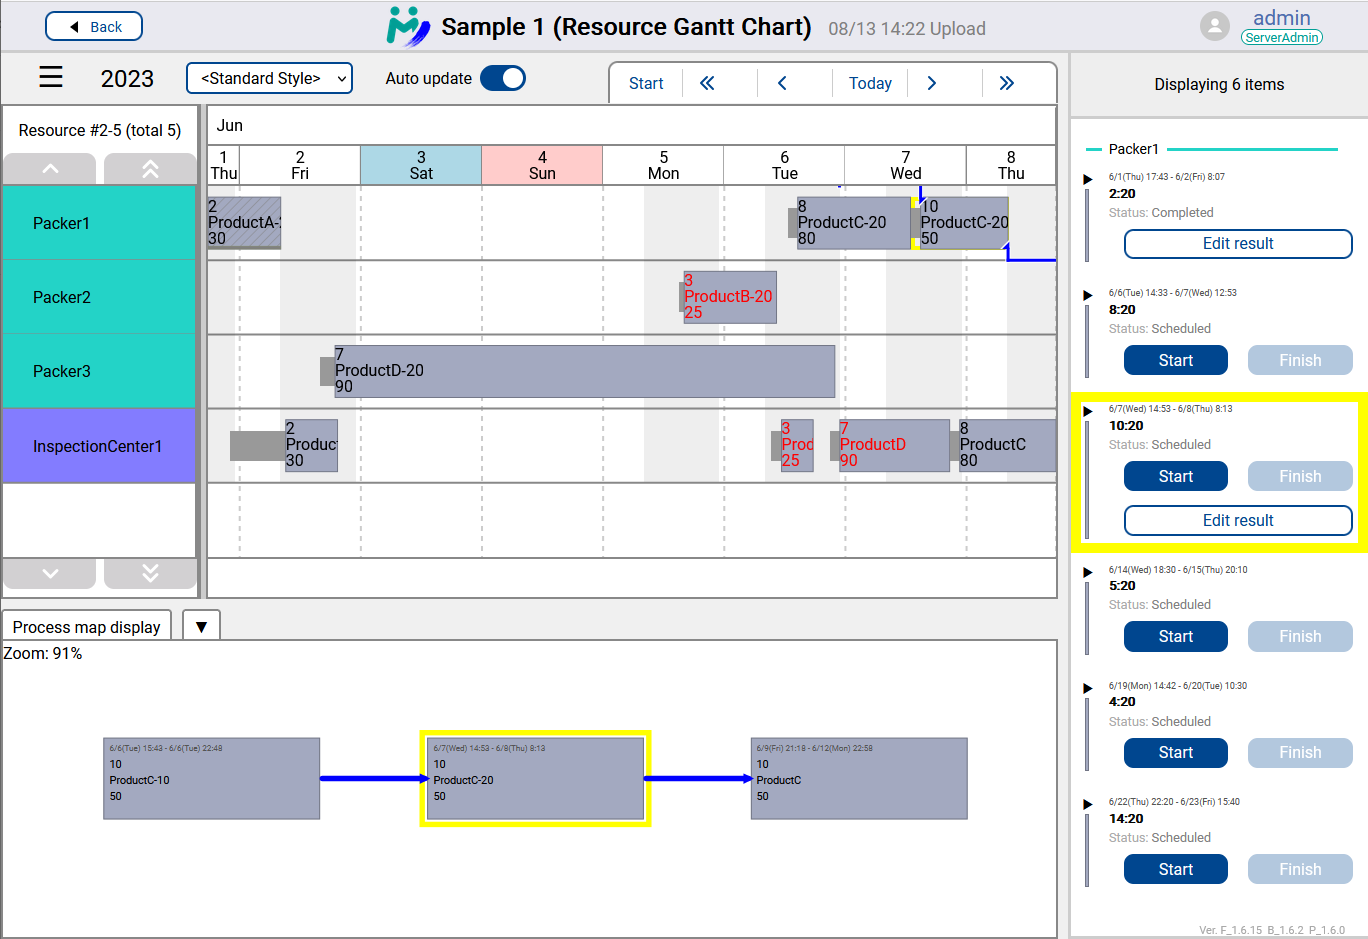 The Gantt Chart section of the Resource Gantt Chart, the timeline display on the right, and the preceding and following process map display are linked. By selecting a task in the preceding and following process map, you can navigate to the corresponding task in the Gantt Chart.
In the image, the yellow frame representing the selected task is visible in the Gantt Chart, timeline display, and preceding and following process map, confirming that the same task is highlighted across all displays.
The Gantt Chart section of the Resource Gantt Chart, the timeline display on the right, and the preceding and following process map display are linked. By selecting a task in the preceding and following process map, you can navigate to the corresponding task in the Gantt Chart.
In the image, the yellow frame representing the selected task is visible in the Gantt Chart, timeline display, and preceding and following process map, confirming that the same task is highlighted across all displays.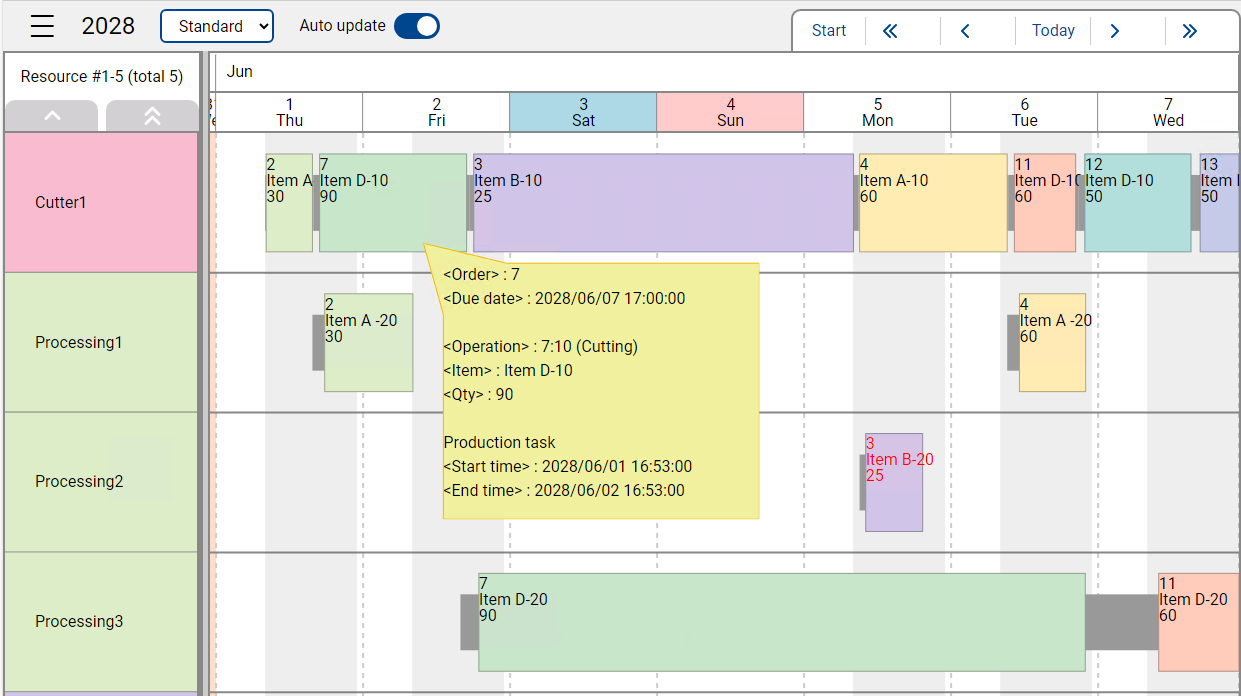 Resource Gantt Chart now supports displaying labels defined in the corresponding style in Asprova.
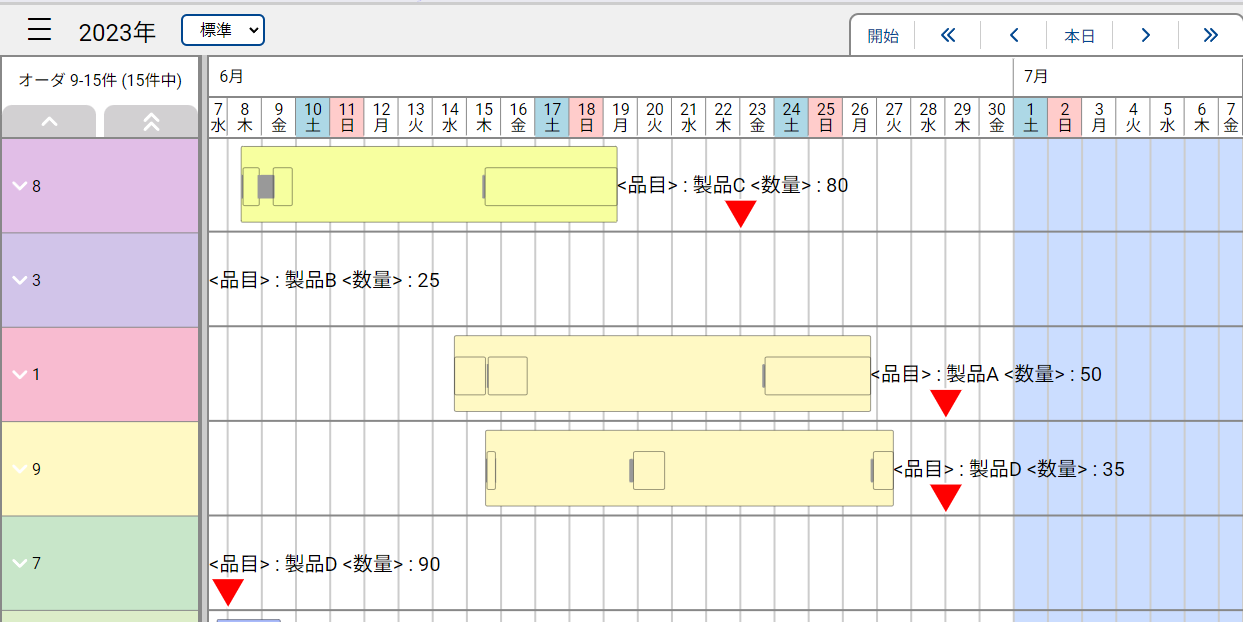
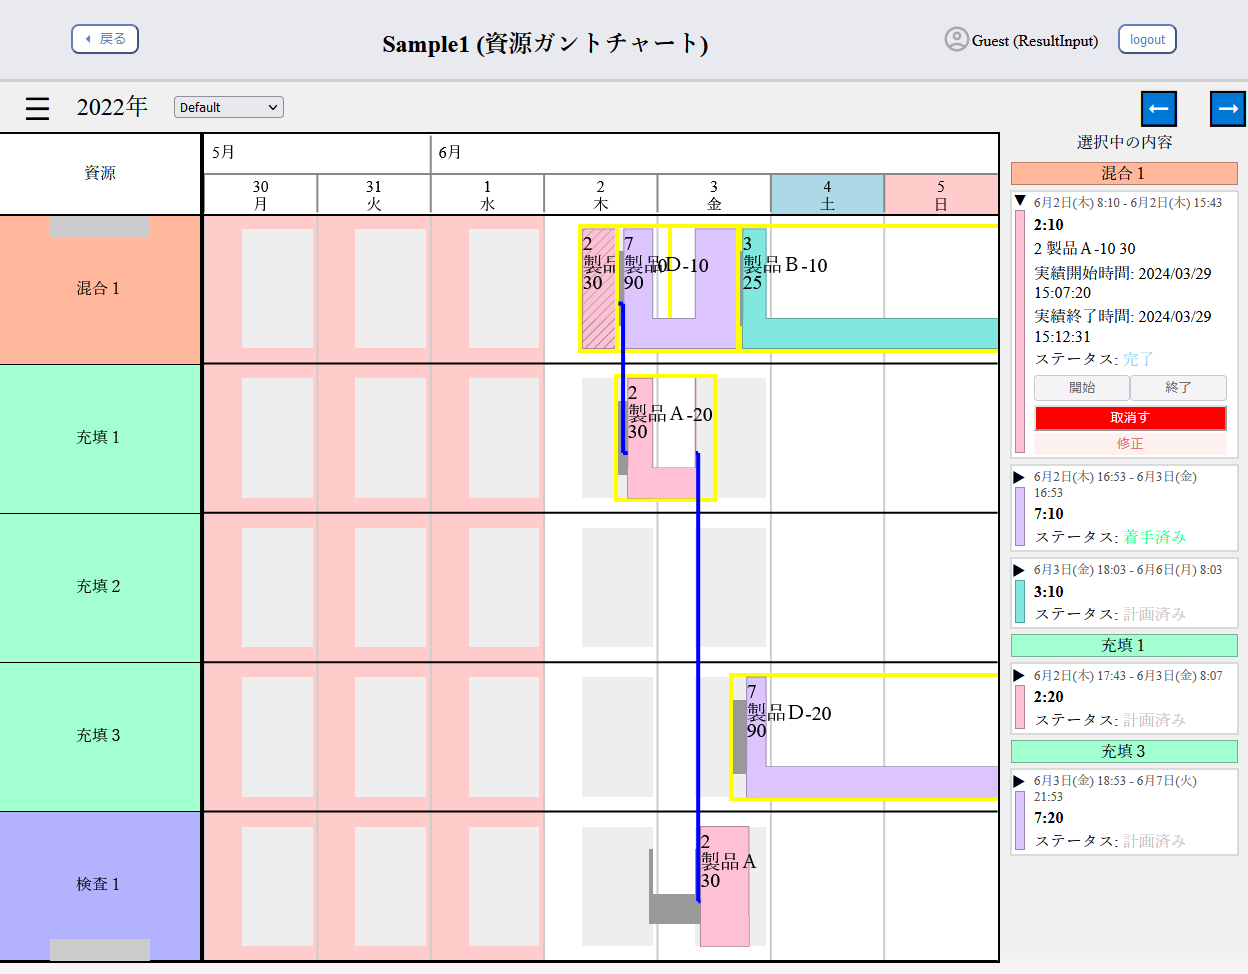
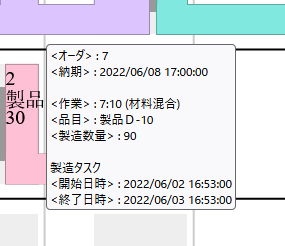
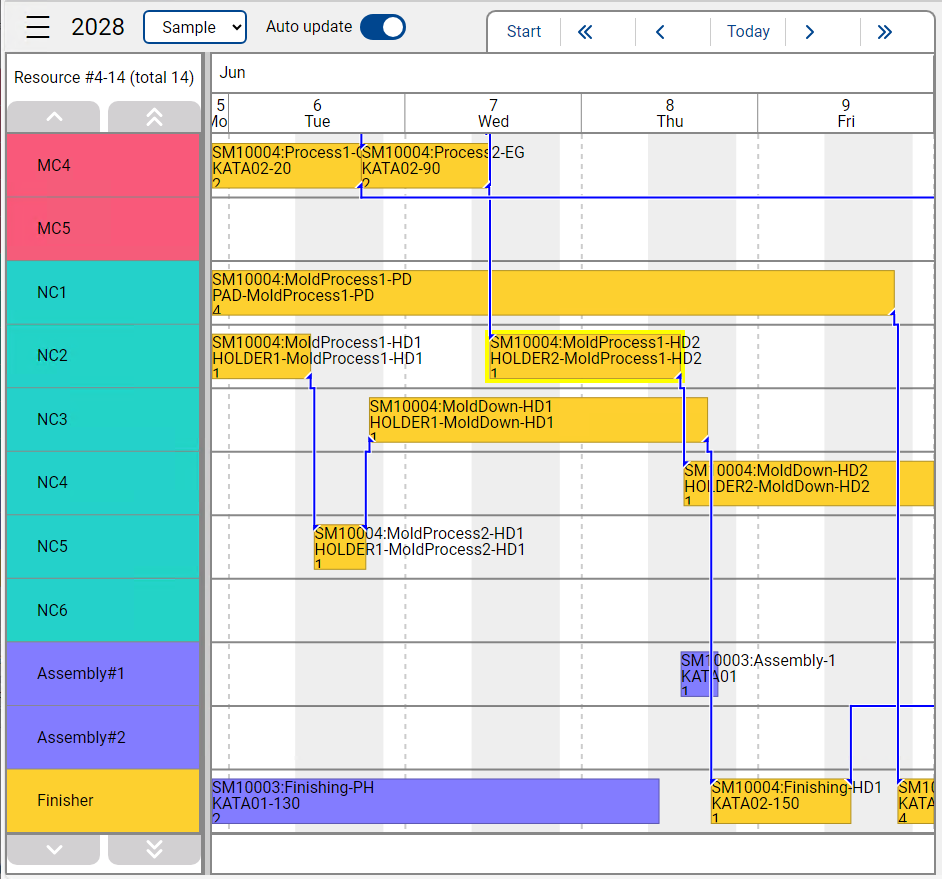 Connection lines on Resource Gantt Chart now has a new look.
Connection lines are drawn by stacking them vertically, and their endpoints now have triangular markers,
which will give users more intuition about the lines' relation with other entities.
Connection lines on Resource Gantt Chart now has a new look.
Connection lines are drawn by stacking them vertically, and their endpoints now have triangular markers,
which will give users more intuition about the lines' relation with other entities.